ManageIQ Euwe GA - Improved Container Management, Public Cloud Support, and more
We’re delighted to announce the release of ManageIQ Euwe! This fifth ManageIQ release is named after Dutch chess Grandmaster Max Euwe.
Since the ManageIQ Darga GA, we’ve had 9 productive sprints with a total of 3025 pull requests in the main ManageIQ repo and 4518 PRs overall (averaging 112/167 pull requests per week). All these activities have translated to a slew of new features, bug fixes, and even some deletions to optimize things.
With growing interest and demand for public cloud providers and containers management in IT service automation, the community has responded with plenty of enhancements in these areas. In addition, there are new provider types such as storage and middleware, gradually piecing together the full stack management view.
Containers Management Improvements
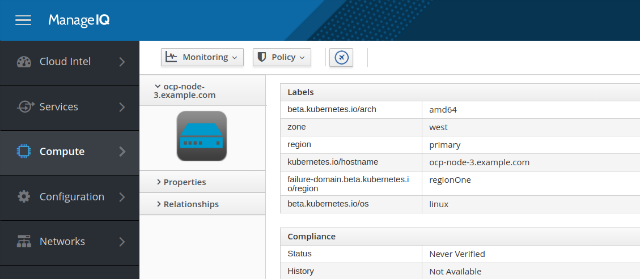
Plenty of new reports and metrics enhancements have been included to let you manage containers with confidence. Pods for images per project and Pods per node are added to operations reporting. Additionally, you can get Chargeback rates for container images filtered by image tags, with support for custom attributes in the reports. Speaking of tags, container objects can be auto-tagged with the same labels in Kubernetes/OpenShift.
The status of metrics collection is shown similarly to inventory collection: the success/failure of the last collection is displayed. Now there are metrics for disconnected container groups as well. Previously, we could only obtain the metrics for container groups that were active when metrics were collected (once per hour), so transient groups (that were created and destroyed between collection times) were not recorded. With the new rollout, metrics for such container groups are made available.
Public Cloud Providers Improvements
The team has been continually enriching features for the public cloud platform Microsoft Azure and making it a first class provider. There is now support for Floating IPs during Azure instance provisioning, with metrics added for network, memory and disk utilization.
Load balancer inventory collection has been added to Azure EMS refresh, as well as support for external proxy. The issue where inventory collection would bypass the proxy when collecting templates has been fixed. You can also make use of provider-specific logging with Azure to make debugging much easier.
A new cache module is deployed in SmartState for Microsoft Azure, which reduces the average read requests from >7000 to <1000. Scan times have also been reduced from >20 min to <5 min!
Finally, we noticed that Azure was missing pre- and post-provision methods in automate modeling, so Azure method points have been added for cloud provisioning in Automate.
Many corresponding enhancements were applied to Google Compute Engine, including metrics, external proxy support, load balancer refresh, and pre/post-provisioning methods and schema changes in the method class for Automate.
During provisioning, the deprecated images are now hidden. Support for parsing Google health checks is added for load balancer refresh.
In GCE, there are preemptible instances. With Google’s contributions, we have inventory collection and provisioning of these preemptible VMs. Support for instance retirement is improved too.
OpenStack Improvements
Working with the Red Hat OpenStack team, we bring you a long list of improvements for the OpenStack cloud provider. To start off, collection of Host Aggregate inventory allows the OpenStack scheduler to enable advanced scheduling. The mapping of external cloud tenants to ManageIQ tenants is achieved with a post-refresh hook on the OpenStack provider which synchronizes after refresh.
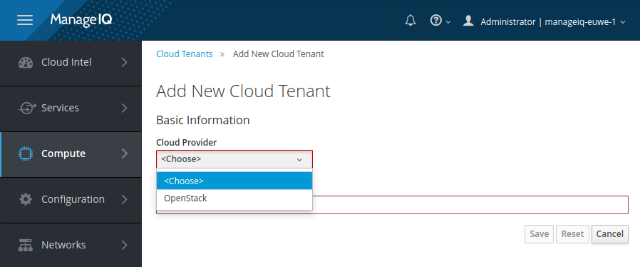
Creating, updating and deleting cloud tenants and host aggregates can now be carried out through the user interface from the Clouds menu under Compute.
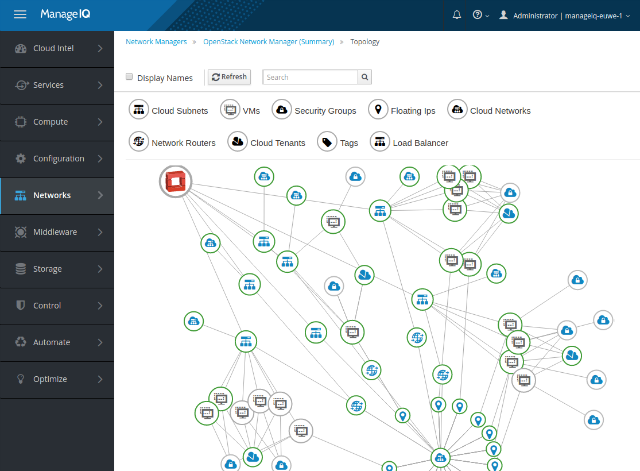
Block storage service is introduced with Cinder backup and restore actions. Snapshot functionality has been added for OpenStack cloud volumes and VMs, and you can create and remove snapshots from the UI. New topology view for OpenStack cloud provider shows the availability zones, tenants and instances.
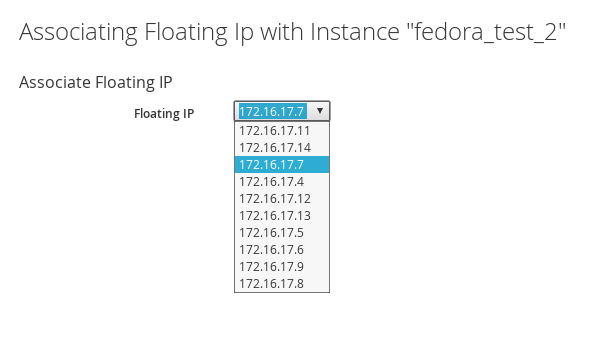
Flavors are mapped to cloud tenants during OpenStack cloud refresh so that they are grouped correctly. Previously, Floating IPs can be assigned only during provisioning; however, with this release associating/disassociating Floating IPs can be controlled from the configuration menu after provisioning.
For the OpenStack infrastructure provider, there was a lot of work done around nodes. The infrastructure nodes can be powered on and off, added or removed. There are additional options for introspecting nodes and setting their provision states. Ironic Controls have been added to the UI, with which Ironic nodes can be registered through Mistral, the OpenStack workflow service. Destroying a node deletes it from Ironic.
Cloud networks, subnets, as well as network routers can be created/updated/deleted with the OpenStack Network Manager. You also have the ability to see additional ports, which are obtained from SmartState analysis. Both infrastructure and network topology views are newly added. Check them out!
New Provider Type: Storage
In this Euwe release, we are adding initial support for Cinder and Swift managers, to manage block storage and object storage respectively. For now, these first storage managers are OpenStack specific, and will be extended in future to support association with other providers or as standalone. The implementation supports managers of either physical or software defined storages.
Swift inventory will cross-link with object stores and instances, while Cinder inventory has cross-linking to cloud volumes and instances. Depending on the environment a storage manager is associated with, it will make the appropriate crosslinks.
As mentioned in the OpenStack updates section, Cinder backup and restore of cloud volumes is available (through UI).
New Provider Type: Middleware
Middleware was initially introduced in the Darga release. Since then, an amazing amount of work has gone into building up this provider type with the Hawkular provider, which is consistently among the top providers in terms of PRs during a sprint.
One of the first things you’ll notice is Middleware as a top level menu item in the ManageIQ interface. From here, one can deploy and operate the middleware infrastructure - provisioning, retiring, and re-configuring middleware application deployments. It supports micro-lifecycle for deployments, which enables both standalone and server group operations.
Users are able to connect to the database by adding Middleware Datasources and JDBC Drivers. These are important pieces for the application servers to establish and manage the connections.
Metrics are added for JMS topics and queues, to show info such as number of consumers and how many messages sent. In addition, there’s live metrics for datasources and transactions. On the reporting side, you can access performance reports for datasources and middleware servers.
For a more visual representation of the middleware infrastructure and applications, take a look at the topology view. Cross-linking middleware servers to VMs indicate the relationships to the compute services running them. Further visualizations in topology graph include domains, datasources, and server groups.
Improvements to Service UI
Formerly known as Self Service UI, this has been renamed to Service UI due to the expanding number of use cases.
To allow for criteria-based VM selection for services, we use arbitration profiles, which are collections of pre-defined settings. In conjunction with the arbitration engine, these provide the ability to implement rules like enforcing a contractor to use AWS profile for development servers. The UI for Arbitration Rules will be in the Service Designer.
One main highlight is the availability of Chargeback for services. The Service UI now supports showing Chargeback report data, which summarizes the cost of VMs grouped by service to the user at time of order. It will be able to display the service cost over past 30 days too.
Other enhancements in API comprise of picture creation (jpg, png, svg formats), support for HTTP OPTIONS on collections, as well as the deletion of service dialogs. There’s also an “About” modal with the Cockpit integration.
Centralized Administration
The role of Centralized Administration is to support the lifecycle management of a lower region from a master region. A ManageIQ operator in the global region is empowered to provision “on behalf” of a remote region.
Server to server authentication enables the invocation of tasks in remote regions from the global region. VM power operations and VM retirement can be initiated from the master region, which are then processed and executed on the lower regions.
Miscellaneous Improvements
Besides copious amounts of new eye-candy for all the added features and new providers, UI performance has seen a boost as well. By optimizing resources and filtering, operations such as page rendering are much faster. For example, Services -> Workloads -> All VMs page load time has reduced from 93,770ms to 524ms (99%) with a test of 20,000 VMs.
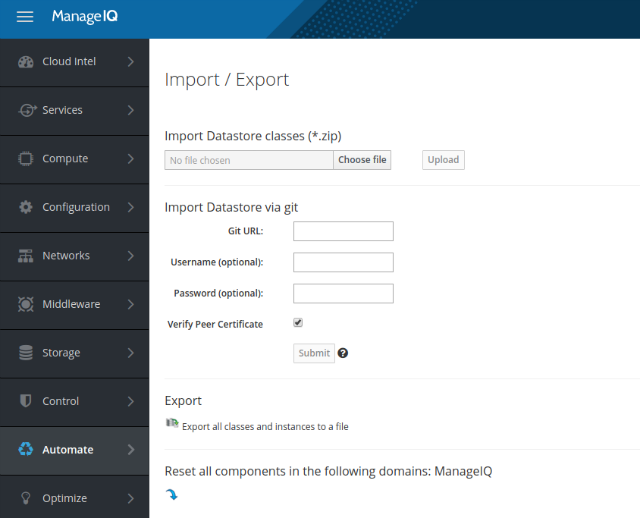
Another addition, which resulted from discussions at the ManageIQ Design Summit this June, is Git Automate Support. With this, you can pull from a git repository using branch/tag to determine which automate domain model is loaded to ManageIQ. The contents are locked when imported, but can be copied to other domains for editing.
The above is by no means an exhaustive list of all the changes to ManageIQ since the last release. We’re so grateful to the remarkably productive contributors in ManageIQ community for making the Euwe release possible! You can find the full changelog here.
Release images for ManageIQ Euwe are available for download. Visit the ManageIQ Community page to find out how to get involved in the community, and where you can connect with us online and in person at events. Documentation and other resources can be found on the (recently renewed) ManageIQ site. Thanks for your support!

