- Managing Infrastructure and Inventory
- Clusters
- Performing SmartState Analysis on Clusters
- Creating a Cluster Comparison Report
- Viewing a Cluster
- Tagging Clusters
- Viewing Capacity and Utilization Charts for a Cluster
- Viewing Cluster Timeline
- Detecting Drift on Clusters
- Creating a Drift Report for Clusters
- Removing Clusters
- Hosts
- Setting a Default Host Filter
- Creating a Host Filter
- Performing SmartState Analysis on Hosts
- Host Comparison Sections
- Using the Host Comparison Sections
- Creating a Host Comparison Report
- Refreshing Multiple Hosts
- Adding a Single Host
- Editing Hosts
- Viewing a Host
- Tagging Multiple Hosts
- Removing Hosts
- Refreshing Relationships and Power States for a Host
- Viewing Capacity and Utilization Charts for a Host
- Viewing the Host Timeline
- Host Virtual Summary
- Viewing Host Device Information
- Viewing Host Network Information
- Viewing Storage Adapters
- Detecting Drift on Hosts
- Creating a Drift Report for Hosts
- Virtual Machines
- Creating a Virtual Machine or Template Filter
- Loading a Report Filter or Search Expression
- Changing Views for Virtual Machines and Templates
- Sorting Virtual Machines and Templates
- Creating a Virtual Machine or Template Report
- Searching for Virtual Machines or Templates
- SmartState Analysis on Red Hat Enterprise Virtualization Manager 3.1 and Above - Storage Support Notes
- SmartState Analysis on Red Hat Enterprise Virtualization Manager 3.0 - Storage Support Notes
- Virtual Machine and Templates Comparison Sections
- Using the Virtual Machine Comparison Sections
- Creating a Virtual Machine Comparison Report
- Controlling the Power State of Red Hat Virtualization Virtual Machines
- Refreshing Virtual Machines and Templates
- Extracting Running Processes from Virtual Machines and Templates
- Setting Ownership for Virtual Machines and Templates
- Removing Virtual Machines and Templates from the VMDB
- Tagging Virtual Machines and Templates
- Viewing a VMware Virtual Machine’s Storage Profile
- Viewing Running Processes after Collection
- Editing Virtual Machine or Template Properties
- Setting Ownership of a Virtual Machine or Template
- Right Sizing a Virtual Machine
- Viewing Capacity and Utilization Charts for a Virtual Machine
- Viewing the Virtual Machine or Template Timeline
- Virtual Machine or Template Summary
- Viewing the Operating System Properties
- Viewing Virtual Machine or Template Snapshot Information
- Viewing User Information for a Virtual Machine or Template
- Viewing Group Information for a Virtual Machine or Template
- Viewing Genealogy of a Virtual Machine or Template
- Comparing Genealogy of a Virtual Machine or Template
- Tagging Virtual Machines or Templates with a Common Genealogy
- Detecting Drift on Virtual Machines or Templates
- Creating a Drift Report for a Virtual Machine or Template
- Viewing Analysis History for a Virtual Machine or Template
- Viewing Disk Information for a Virtual Machine or Template
- Reconfiguring Virtual Machines
- Adding a Disk to a Virtual Machine
- Removing a Virtual Machine Disk
- Resizing a Virtual Machine Disk
- Increasing or Decreasing a Virtual Machine’s Memory Size
- Reconfigure a Virtual Machine’s Processors
- Adding or Removing Virtual Machine Network Adapters
- Attach or Remove an ISO (VMware Virtual Machines Only)
- Viewing Event Logs for a Virtual Machine or Template
- Remote Consoles
- Managing Virtual Machine Snapshots
- Creating a Virtual Machine Snapshot
- Deleting a Virtual Machine Snapshot
- Reverting a Virtual Machine to a Snapshot
- Creating a Template Based on a Virtual Machine
- Retiring Virtual Machines
- Migrating Virtual Machines
- Resource Pools
- Removing a Resource Pool
- Tagging a Resource Pool
- Viewing the Resource Pool Summary
- Resource Pools Accordion
- Datastores
- Performing SmartState Analysis on Datastores
- Viewing a Datastore
- Tagging a Datastore
- Viewing Capacity and Utilization Charts for a Datastore
- Removing a Datastore
- Data Optimization
- PXE Servers
- Availability Zones
- Viewing an Availability Zone
- Viewing Availability Zone Relationships
- Cloud Tenants
- Viewing Cloud Tenant Relationships
- Volumes
- Creating Volumes
- Creating a Snapshot of a Volume
- Attaching a Volume to an Instance
- Detaching a Volume from an Instance
- Editing a Volume
- Deleting a Volume
- Creating Volumes
- Creating a Backup of a Volume
- Restoring a Volume from a Backup
- Restoring a Cloud Volume from a Backup
- Deleting a Cloud Volume Backup
- Creating a Snapshot of a Volume
- Attaching a Volume to an Instance
- Detaching a Volume from an Instance
- Editing a Volume
- Deleting a Volume
- Creating Volumes
- Attaching a Volume to an Instance
- Detaching a Volume from an Instance
- Deleting a Volume
- Flavors
- Creating a Flavor
- Viewing a Flavor
- Viewing Flavor Relationships
- Deleting a Flavor
- Cloud Networks
- Instances and Images
- Using an Instance or Image Filter
- Creating an Instance or Image Filter
- Loading a Report Filter or Search Expression
- Changing Views for Instances and Images
- Sorting Instances and Images
- Creating an Instance or Image Report
- Searching for Instances or Images
- Analyzing Instances and Images with SmartState Analysis
- Creating an Instance Comparison Report
- Refreshing Instances and Images
- Extracting Running Processes from Instances and Images
- Setting Ownership for Instances and Images
- Removing Instances and Images from the VMDB
- Tagging Instances and Images
- Reviewing an Instance or Image
- Viewing Running Processes after Collection
- Managing Security Groups for Cloud Instances
- Editing Instance or Image Properties
- Controlling the Power State of an Instance
- Right Sizing an Instance
- Viewing Capacity and Utilization Charts for an Instance
- Viewing the Instance or Image Timeline
- Viewing the Instance or Image Summary
- Viewing User Information for an Instance or Image
- Viewing Group Information for an Instance or Image
- Viewing Genealogy of an Instance or Image
- Detecting Drift on Instances or Images
- Creating a Drift Report for an Instance or Image
- Viewing Analysis History for an Instance or Image
- Viewing Event Logs for an Instance or Image
- Orchestration Stacks
- Tagging Orchestration Stacks
- Retiring Orchestration Stacks
- Removing Orchestration Stacks
- Key Pairs
- Adding a New Key Pair
- Removing a Key Pair
- Downloading Key Pairs
- Object Stores
- Tagging Object Stores
- VMware Networking Switches
- Tagging VMware Networking Switches
- Container Entities
Managing Infrastructure and Inventory
Clusters
Clusters provide high availability and load balancing for a group of hosts. The Clusters page under Compute > Infrastructure displays the clusters discovered in your enterprise environment.
Note:
Any filter applied will be in effect here.

Use the Clusters Taskbar to manage the analysis and tagging of your clusters. These buttons manage multiple clusters at one time. To manage one cluster, click on that cluster in the main area of the screen.
Performing SmartState Analysis on Clusters
Analyze a cluster to gather historical data to compare with previous points in time.
-
Browse to menu: Compute > Infrastructure > Clusters.
-
Check the clusters to analyze.
-
Click Configuration, and then
 (Perform SmartState Analysis).
 -
Click OK.
The SmartState Analysis begins and returns the current data.
Comparing Clusters
ManageIQ provides features to compare properties of clusters.
-
Browse to menu: Compute > Infrastructure > Clusters.
-
Check the clusters to compare.
-
Click Configuration, and then
 (Compare Selected items). The
comparison displays in a default expanded view and lists a limited
set of properties.
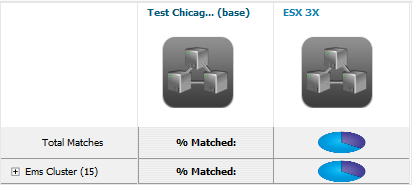
-
To delete a cluster from the comparison, click
 (Remove this Cluster from the
Comparison).
 -
To go to a compressed view, click
 (Compressed View). To return to an expanded view, click
 (Expanded View).
 -
To change the base cluster that all other clusters compare to, click its label at the top of its column.
-
To go to the cluster summary screen, click its virtual thumbnail or icon.
-
There are three buttons in the taskbar to limit the type of views:
-
Click
 (All attributes) to see all
attributes.
 -
Click
 (Attributes with different
values) to see only the attributes that are different across
clusters.
 -
Click
 (Attributes with the same
values) to see only the attributes that are the same across
clusters.
-
-
To limit the mode of the view, there are two taskbar buttons.
-
Click
 (Details Mode) to see all
details for an attribute.
 -
Click
 (Exists Mode) to only see if
an attribute exists compared to the base or not. This only
applies to attributes that can have a Boolean property. For
example, a user account exists or does not exist, or a piece of
hardware that does or does not exist.
-
This creates a comparison between clusters. Export this data or create a report from your comparison for analysis using external tools.
Creating a Cluster Comparison Report
Create a quick report of to compare clusters in CSV, TXT, or PDF formats.
-
Create the comparison to analyze.
-
Click
 (Download).
 -
Click the output button for the type of report.
-
Click
 (Download comparison report in
TXT format) for a text file.
 -
Click
 (Download comparison report in
CSV format) for a comma-separated file.
 -
Click
 (Download comparison report in
PDF format) for a PDF file.
-
Viewing a Cluster
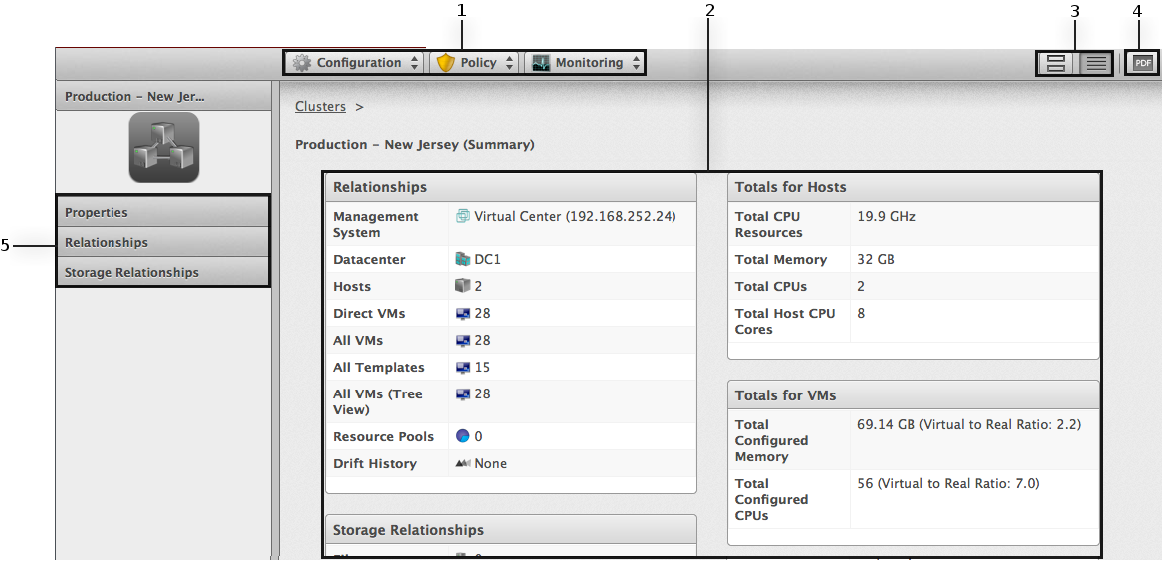
You can click on a specific cluster to view its details. The screen provides you with a cluster taskbar, a cluster accordion, and a cluster summary.
Cluster Management Screen.
-
Cluster Taskbar: Choose between Configuration, Policy and Monitoring options for the selected cluster
-
Cluster Summary: See cluster summary such as Relationships, Totals for Hosts, Totals for VMs
-
Cluster Summary Views: Choose between graphical or text view of the cluster summary
-
Cluster Summary PDF: Generates cluster summary in PDF format
-
Cluster Accordion: See details about Properties, Relationships, Storage Relationships for the selected cluster
Tagging Clusters
Use tags to categorize clusters.
-
Browse to menu: Compute > Infrastructure > Clusters.
-
Check the Clusters to tag.
-
Click
 Policy, and then
  Edit Tags.
-
Select a customer tag from the first dropdown, and then a value for the tag.
-
Select more tags or click Save to save your changes.
Viewing Capacity and Utilization Charts for a Cluster
View capacity and utilization for a cluster.
-
Browse to menu: Compute > Infrastructure > Clusters.
-
Click the cluster to view Capacity and Utilization data.
-
Click
 (Monitoring), and then
 (Utilization) or from the accordion
menu, click Properties > Capacity & Utilization.
-
From Interval, select to view hourly or daily data points and the dates to view data. Use Group by to group the lines by SmartTags. Use Time Profiles to select a time range for the data.
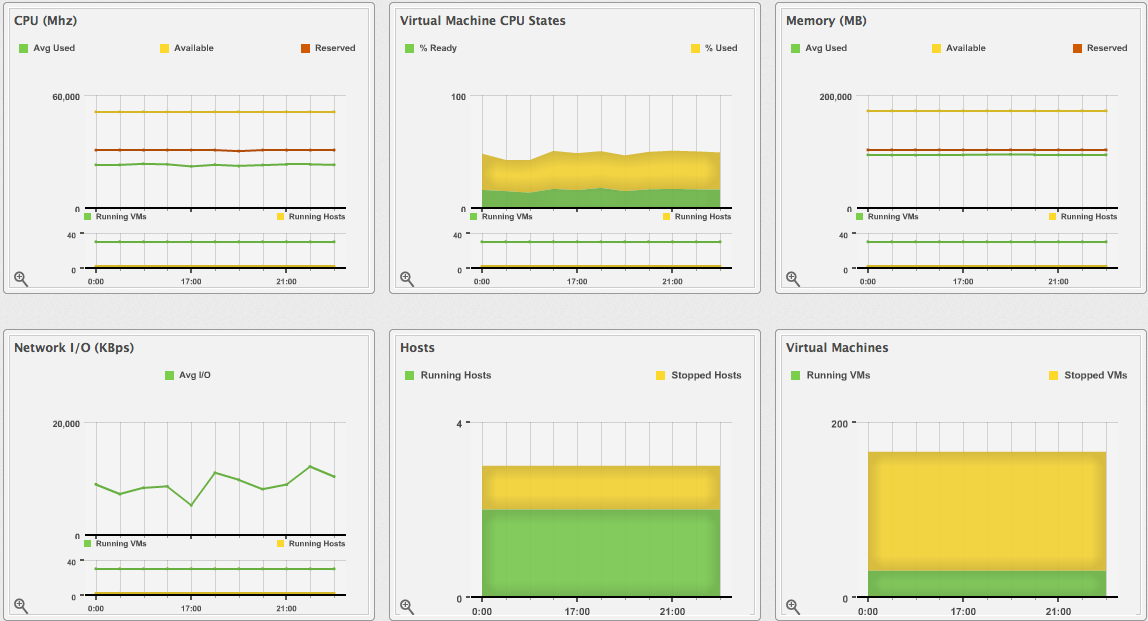
The Capacity & Utilization charts display
Note:
Daily charts only include full days of data. If a day does not include all the 24 data points for a day, the data does not show for that day.
For information about data optimization including utilization trend reports, see Data Optimization.
Viewing Cluster Timeline
Use the cluster timeline to see a graphical depiction of operational and configuration events over time.
-
Browse to menu: Compute > Infrastructure > Clusters.
-
Click the cluster to view the timeline.
-
Click
 (Monitoring), and then
 (Timelines) or from the accordion
menu, click menu: Properties > Timelines.
 -
From Options, customize the period of time to display, and the types of events to see.

-
Use the Interval dropdown to select hourly or daily data points.
-
Use Date to type the date for the timeline to display.
-
If you select to view a daily timeline, use Show to set how many days back to go. The maximum history is 31 days.
-
The three Event Group dropdowns allow the selection of different groups of events to display. Each has its own color.
-
From the Level dropdown, select a Summary event if needed, or a Detail list of events. For example, the detail level of a Power On event might include the power on request, the starting event, and the actual Power On event. If you select Summary, the timeline only displays the Power On event.
-
-
To see more detail on an item in the timeline, click on it. A balloon appears with a clickable link to the resource.
Detecting Drift on Clusters
Over time, a cluster’s configuration might change. Drift is the comparison of a cluster to itself at different points in time. The cluster requires analysis at least twice to collect information. Detecting drift provides users with the following benefits:
-
See the difference between the last known state of a cluster and its current state
-
Review the configuration changes that happen to a particular cluster between multiple points in time.
-
Capture the configuration drifts for a single cluster across a time period.
Detect drift on clusters:
-
Browse to menu: Compute > Infrastructure > Clusters.
-
Click on the cluster to view drift.
-
Click Relationships in the cluster accordion.
-
Click Drift History.
-
Check the analyses to compare.
-
Click
 (Drift Analysis) at the top of
the screen. The results are displayed.
 -
Check the Comparison sections on the left to view in your comparison.
-
Click the plus sign next to the section name to expand it.
-
An item displayed on red text shows a change from the base analysis. An item displayed in black text shows no change from the base analysis.
-
A
 (Changed from previous) shows
there has been a change since the last analysis.
 -
A
 (Same as previous) means there
has been no change since the last analysis.
 -
Click
 (Remove from drift) at the
bottom of a column to remove a specific analysis. The drift is
then recalculated and the new results display.
-
-
Click
 (Expanded View) to see the
expanded view. Click
  (Compressed
View)] to compress the information.
 -
Click the minus sign next to the section name to collapse it.
-
To limit the type of views, there are three buttons in the taskbar.
-
Click
 (All attributes) to see all
attributes of the sections selected.
 -
Click
 (Attributes with different
values) to see only the attributes different across drifts.
 -
Click
 (Attributes with the same
values) to see only the attributes the same across drifts.
-
The drift displays for your cluster. Download the data or create a report from the drift for analysis using external tools.
Creating a Drift Report for Clusters
Use the drift report feature to export information about your cluster’s drift.
-
Create a drift of a cluster.
-
Click
 (Download).
 -
Click the output button for the type of report you want.
-
Click
 (Download drift report in TXT
format) for a text file.
 -
Click
 (Download drift report in CSV
format) for a comma-separated file.
 -
Click
 (Download drift report in PDF
format) for a PDF file.
-
Removing Clusters
If a cluster has been decommissioned or requires troubleshooting, it might require removal from the VMDB.
-
Browse to menu: Compute > Infrastructure > Clusters.
-
Check the clusters to remove.
-
Click Configuration, and then
 (Remove Clusters from the VMDB).
 -
Click OK.
The clusters are deleted. Any virtual machines or hosts associated with these clusters remain, but are no longer associated with them.
Hosts
The Hosts page under Compute > Infrastructure displays the hosts discovered in your enterprise environment.
Note:
Any applied filters will be in effect here.

After adding or sorting your hosts, click on one to examine it more closely and see its virtual machines, SmartProxy settings, and properties.

-
Top left quadrant: Number of virtual machines on this host
-
Bottom left quadrant: Virtual machine software
-
Top right quadrant: Power state of host
-
Bottom right quadrant: Authentication status
| Icon | Description |
|---|---|
 |
Validated: Valid authentication credentials have been added. |
 |
Invalid: Authentication credentials are invalid |
 |
Unknown: Authentication status is unknown or no credentials have been entered. |
Filtering Hosts
The Host Filter accordion is provided to easily navigate through the hosts. Use the ones provided or create your own. In addition, you can set a default filter.
Setting a Default Host Filter
Set the default filter for viewing your hosts.
-
From the Filters accordion on the left, click on the filter to use.
-
Click Set Default at the top of the filters list.
The default filter is set and marked by a green star next to its name.
Creating a Host Filter
Create a filter for viewing your hosts.
-
Browse to menu: Compute > Infrastructure > Hosts.
-
Click
 (Advanced Search) to open the
expression editor.
 -
Use the expression editor to choose the appropriate options for your criteria.
-
Click Save.
-
Type in a name for the search expression in Save this search as.
Note:
This title depends on the type of resource you are searching.
-
Click Save.
The filter is saved and displays in the My Filters area of the Filter accordion.
Performing SmartState Analysis on Hosts
Perform a SmartState analysis on a host to collect additional information about it, such as patches, CPU, and memory.
Note:
-
SmartState analysis on hosts is processed by the Provider Operations role. It is enabled by default.
-
For ESX or ESXi hypervisors, consider the following: ESX hosts utilize a service console for host management and can be accessed using SSH. ESXi hosts lack a service console and therefore SSH cannot be used to obtain information sets for patches, services, Linux packages, user groups, SSH Config, and FS Files.
-
rootor administrator credentials are required to get patch information.
-
Browse to menu: Compute > Infrastructure > Hosts.
-
Check the hosts to analyze.
-
Click Configuration, and then
 (Perform SmartState Analysis).
 -
Click OK.
Comparing Hosts
ManageIQ allows you to compare hosts and check operating systems, host software and version information, and hardware.
-
Browse to menu: Compute > Infrastructure > Hosts.
-
Check the hosts to compare.
-
Click Configuration, and then
 (Compare selected Hosts). The
comparison displays in a default expanded view, which lists a
limited set of properties.
 -
To remove a host from the comparison, click
 (Remove this Host from the comparison)
at the bottom of the column.
 -
To go to a compressed view, click
 (Compressed View). To return to an expanded view, click
 (Expanded View).
 -
To limit the mode of the view, there are two buttons in the taskbar.
-
Click
 (Details Mode) to see all
details for an attribute.
 -
Click
 (Exists Mode) to limit the
view to if an attribute exists compared to the base or not. This
only applies to attributes that can have a Boolean property. For
example, a user account exists or does not exist, or a piece of
hardware that does or does not exist.
-
-
To change the base host that compare to the other hosts, click its label at the top of its column.
-
To go to the summary screen for a host, click its virtual thumbnail or icon.
Host Comparison Sections
| Section | Description |
|---|---|
| Host Properties | Use this section to see basic information of the host, such as hostname, product, build number, hardware, and network adapters. |
| Security | Use this to see users and groups for the host, and firewall rules. |
| Configuration | Use this to see the operating system, applications, services, patches, vSwitches, vLANS, and advanced settings. |
| My Company Tags | Use this to see all tags. |
Using the Host Comparison Sections
The following procedure describes how to use the host comparison sections.
-
On the left of a comparison screen, select the categories of properties to display.
-
Click the plus sign next to the sections name to expand it.
-
The following descriptions pertain to the Expanded View
 . Either the value of a property or an icon
representing the property displays depending on the properties type.
. Either the value of a property or an icon
representing the property displays depending on the properties type.-
A property displayed in the same color as the base means that the compared host matches the base for that property.
-
A property displayed in a different color from the base means that the compared host does not match the base for that property.
-
-
If you are in the Compressed View
 , the
values of the properties do not display. All items are described by
the icons shown below.
, the
values of the properties do not display. All items are described by
the icons shown below.-
A
 (checkmark) means the compared
host matches the base for that property. Hover over it and the
value of the property displays.
 -
A
 (x) means the compared host does
not match the base for that property. Hover over it and the
value of the property displays.
-
-
Click the plus sign next to the section name to collapse it.
This comparison is viewable in multiple ways. Export the data or create a report from your comparison for analysis using external tools.
Creating a Host Comparison Report
Create a quick report to compare clusters in CSV, TXT, or PDF formats.
-
Create the comparison to analyze.
-
Click
 (Download).
 -
Click the output button for the type of report.
-
Click
 (Download comparison report in
TXT format) for a text file.
 -
Click
 (Download comparison report in
CSV format) for a comma-separated file.
 -
Click
 (Download comparison report in
PDF format) for a PDF file.
-
Refreshing Multiple Hosts
Manually refresh a host for its properties and related infrastructure components.
-
Browse to menu: Compute > Infrastructure > Hosts.
-
Check the hosts to refresh.
-
Click Configuration, and then
 (Refresh Relationships and Power
States).
 -
Click OK.
When a host is refreshed and a new virtual machine is discovered on that host, ManageIQ checks to see if the virtual machine is already registered with another host. If this is the case, the host that the virtual machine is associated with switches to the new host. If the SmartProxy is monitoring a provider, this happens automatically. If not, the next refresh of the host addresses this.
Adding a Single Host
To analyze a host for more detailed information, add it to the VMDB first. If the host has not been found during Host Discovery or Provider Refresh, and the host’s IP address is known, use the Add a New Host button.
-
Browse to menu: Compute > Infrastructure > Hosts.
-
Click Configuration, then click (../images/1862.png)Add a New item.
-
Type the Name, Host Name, and IP Address of the host to add. Name is how the device is labeled in the console. Select the type of operating system from the Host Platform dropdown. If the Host has been found during Discovery or Refresh and the host’s operating system has been identified, the Host Platform selector remains disabled. If adding an IPMI server for provisioning, add in the IP address of that host.
Important: The Host Name must use a unique fully qualified domain name.
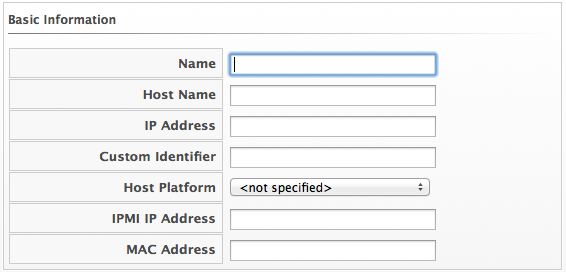
-
In the Credentials box, the Default tab provides fields to type a user name with elevated security credentials and the user’s password. If using domain credentials, the format for User ID is in the format of
[domainname]\[username]. On ESX hosts, if theSSHlogin is disabled for the Default user, type in a user with remote login access on the Remote Login tab.
-
Click Validate to check the credentials.
-
Click Save.
Editing Hosts
If multiple hosts have the same settings or credentials, edit them at the same time.
-
Browse to menu: Compute > Infrastructure > Hosts.
-
Click Configuration.
-
Check the Hosts to edit.
-
Click
 (Edit Selected items).
 -
Use Credentials to provide login credentials required for this host.
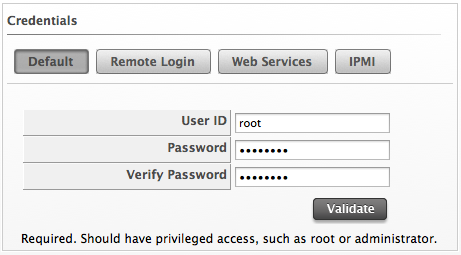
-
On the Default tab, type a user name with elevated security credentials and the users password. If you are using domain credentials, the format for User ID must be in the format of
[domainname]\[username]. -
On
ESXhosts, ifSSHlogin is disabled for the Default user, type in a user with remote login access on the Remote Login tab. If this is not supplied, Default credentials will be used. -
Use Web Services to supply credentials for any web service calls made directly to the host system. If this is not supplied, Default credentials are used.
Note:
Login credentials are required for performing SmartState Analysis on the host’s virtual machines and templates.
For each type of credential used, the following information is required:
-
Use User ID to specify a login ID.
-
Use Password to specify the password for the User ID.
-
Use Verify Password to confirm the password.
-
-
Test the credentials by using the Select Host to validate against drop down and click Validate.
-
Click Save.
Viewing a Host
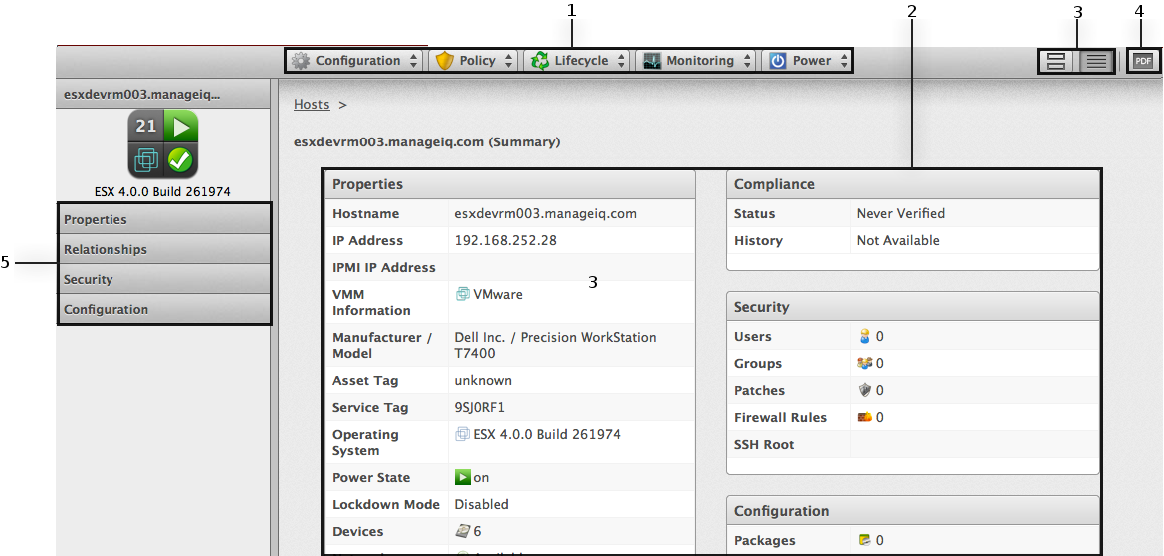
You can click on a specific host to review it. The screen shows a host virtual thumbnail, a host taskbar, a host accordion, and a host summary.
Host Management Screen.
-
Host Taskbar: Use the host taskbar to take actions on the selected host
-
Host Summary: Use the host summary to see the properties of a host, drill down to a host’s information, and view its installed virtual machines
-
Host Summary Views: Choose between graphical or text view of the provider summary
-
Host PDF: Generates host summary in PDF format
-
Host Accordion: See details about Properties, Relationships, Security and Configuration for the selected host
Tagging Multiple Hosts
To categorize hosts together, apply tags to multiple hosts at the same time.
-
Browse to menu: Compute > Infrastructure > Hosts.
-
Check the hosts to tag.
-
Click
 (Policy), and then
 (Edit Tags).
 -
Select a customer tag from the first dropdown, and then a value for the tag.

-
Select more tags or click Save to save your changes.
Removing Hosts
If a host is decommissioned or requires troubleshooting, it might require removal from the VMDB.
-
Browse to menu: Compute > Infrastructure > Hosts.
-
Check the hosts to remove.
-
Click Configuration, and then
 (Remove items from the VMDB).
 -
Click OK.
The hosts are removed. The virtual machines remain in the VMDB, but are no longer associated with their respective hosts.
Scaling Down Compute Hosts
Through ManageIQ, you can perform a Compute scale down on a Red Hat OpenStack infrastructure provider. This process involves decreasing its Compute nodes used by an OpenStack infrastructure provider. Doing so involves putting a Compute node into maintenance mode and removing it from the provider afterwards. Once a node is in maintenance mode, it can be repurposed (for examle, re-provision it as a Controller node), repaired, or decommissioned altogether.
Before scaling down, evacuate or migrate any instances hosted on the node you are removing. For instructions on either procedure, see Migrating a Live Instance or Evacuating an Instance.
After migrating or evacuating instances from the node, set the node to maintenance mode. To do so:
-
Browse to menu: Compute > Infrastructure > Hosts.
-
Click the OpenStack compute node to be removed from the provider.
-
Click Configuration, and then
 (Toggle Maintenance Mode).
Note:
This option can only be used with OpenStack providers with at least two Compute nodes.
Repeat this procedure for every node you want to remove from the cloud provider.
After setting a Compute node to maintenance mode, you can scale down its provider:
-
Browse to menu: Compute > Infrastructure > Providers.
-
Click the provider to be scaled down.
-
Click Configuration, and then
 (Scale Down).
 -
From the Scale Infrastructure Provider Down section, check the nodes to be removed from the provider. You can only do this for nodes where Maintenance is set to true.
-
Click Scale Down.
Refreshing Relationships and Power States for a Host
Refresh the relationships and power states of the items associated with your hosts from the Host Taskbar.
Note:
root or administrator credentials are required to get patch
information.
-
Browse to menu: Compute > Infrastructure > Hosts.
-
Click on the host to refresh.
-
Click Configuration, and then
 (Refresh Relationships and Power
States) on the Host Taskbar.
ManageIQ determines the state (running, stopped, or paused) of all virtual machines registered to the host.
Viewing Capacity and Utilization Charts for a Host
View Capacity & Utilization data for hosts that are part of a cluster.
Note:
Your ManageIQ server requires network visibility to the provider assigned the Server Role of Capacity & Utilization Collector to enable this feature.
-
Browse to menu: Compute > Infrastructure > Hosts.
-
Click the Host to view capacity data.
-
Click
 (Monitoring), and then
 (Utilization) or from the Host
accordion, click Properties > Capacity & Utilization.
 -
From Interval, select to view hourly or daily data points and the dates to view data. Use Group by to group the lines by SmartTags. Use Time Profiles to select a time range for the data.

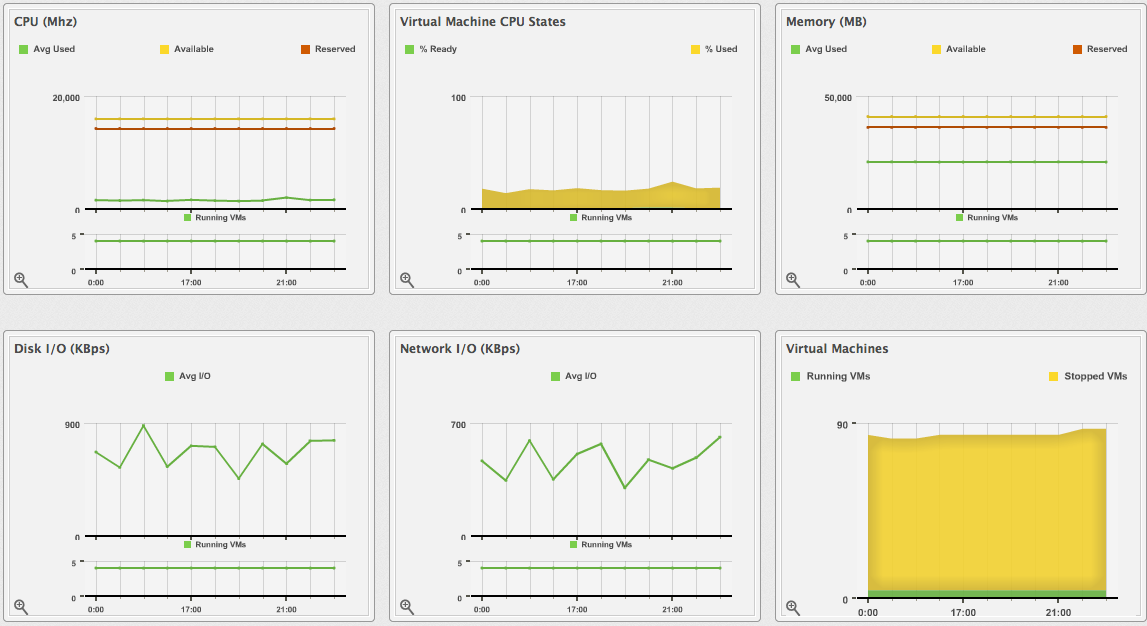
The charts are displayed for CPU, memory, disk, network, and running virtual machines.
Note:
Daily charts only include full days of data. If a day does not include all the 24 data points for a day, the data does not show for that day.
For information about data optimization including utilization trend reports, see Data Optimization.
Viewing the Host Timeline
View the timeline of events for the virtual machines registered to a host.
-
Browse to menu: Compute > Infrastructure > Hosts.
-
Click the host to view the timeline.
-
Click
 (Monitoring), and then
 (Timelines) or from the host
accordion, click Properties > Timelines.
 -
From Options, customize the period of time to display and the types of events to see.
-
Use Show to select types of events to show on the timeline.
-
Use the Interval dropdown to select hourly or daily data points.
-
Use Date to type the date the timeline displays.
-
If you select to view a daily timeline, use Show to set how many days back to go. The maximum history is 31 days. If selecting Hourly, select the interval to see.
-
From the Level dropdown, select either a Summary event or a Detail list of events. For example, the detail level of a Power On event might include the power on request, the starting event, and the actual Power On event. If you select Summary, only the Power On event appears in the timeline.
-
The three Event Group dropdowns allow selection of different groups of events to display. Each group has its own color.
-
-
To see more detail on an item in the timeline, click on it. A balloon appears with a clickable link to the resource.
Host Virtual Summary
Clicking on a specific host shows the Host’s Virtual Thumbnail and an
operating system-sensitive screen of host information, called the Host
Summary. Where applicable, click on a subcategory of the Host Summary to
see more detail on that section.
A Refresh provides some basic information on the Host. To get more detail, enter credentials for the host and perform a SmartState Analysis.
The Summary divides into the following categories.
-
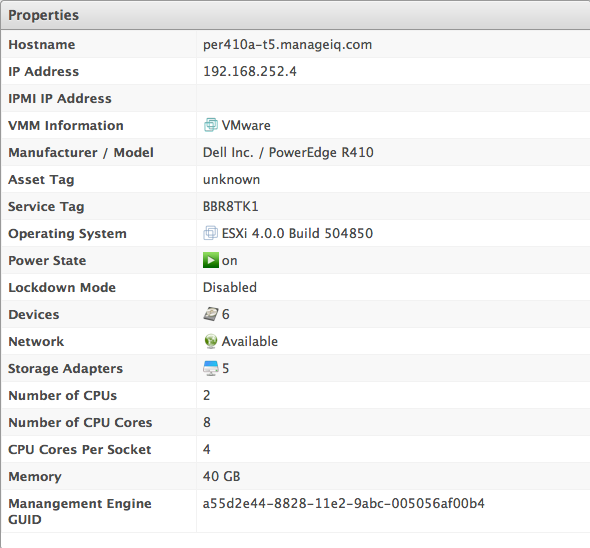
Properties include information such as base operating system, hostname, IP addresses, devices attached to the system, and storage adapters. Some categories can be clicked on for additional detail. For example, click Network to view the network adapters connected to the host.
-
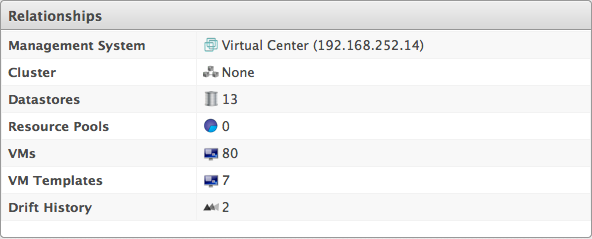
Relationships include information on the provider, cluster, datastores, resource pools, and installed virtual machines.
-
Security shows the number of users, groups, patches installed, and firewall rules on the host. Click on any of these items to see further details.
Note:
Run a SmartState Analysis on the host to retrieve this information.
-
Storage Relationships shows the relationship the host has to LUNs, volumes, and file shares. The Storage Inventory Role must be enabled in the zone for these items to be populated.
-
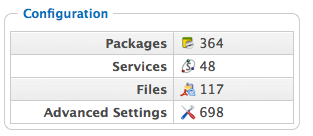
Configuration shows the number of packages and services installed. Click on any of these items to see more details.
Note:
Run a SmartState Analysis on the host to retrieve this information.
-
Smart Management shows all tags assigned to this host.
-
Authentication Status shows all the types of credentials entered for this host and the whether those credentials are valid.
Viewing Host Device Information
Access information on the hardware devices including processor, CPU type and speed, and memory for each host.
-
Browse to menu: Compute > Infrastructure > Hosts.
-
Click the host to view the network information.
-
From the host accordion, click menu: Properties > Devices.
Viewing Host Network Information
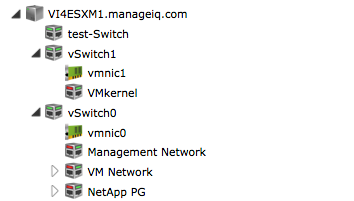
Access information on networking including switches, network interfaces, and local area networks for each host.
-
Browse to menu: Compute > Infrastructure > Hosts.
-
Click the host to view the network information.
-
From the host accordion, click menu: Properties > Network.
Viewing Storage Adapters
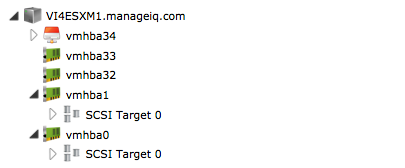
Access information on the storage adapters including storage type for each host.
-
Browse to menu: Compute > Infrastructure > Hosts.
-
Click the host to view the network information.
-
From the host accordion, click menu: Properties > Storage Adapters.
Detecting Drift on Hosts
Over time, the configuration of a host might change. Drift is the comparison of a host to itself at different points in time. The host requires analysis at least twice to collect information. Detecting drift provides you the following benefits:
-
See the difference between the last known state of a host and its current state.
-
Review the configuration changes that happen to a particular host between multiple points in time.
-
Capture the configuration drifts for a single host across a time period.
Detect drift on hosts:
-
Browse to menu: Compute > Infrastructure > Hosts.
-
Click on the host to view drift.
-
Click Relationships in the host accordion.
-
Click Drift History.
-
Check the analyses to compare.
-
Click
 (Drift) at the top of the
screen. The results display.
 -
Check the Comparison sections on the left to view in your comparison.
-
Click Apply.
-
Click the plus sign next to the sections name to expand it.
-
An item displayed on red text shows a change from the base analysis. An item displayed in black text shows no change from the base analysis.
-
A
 (Changed from previous) shows a
change since the last analysis.
 -
A
 (Same as previous) means no
change since the last analysis.
 -
Click
 (Remove from drift) at the
bottom of a column to remove a specific analysis. The drift
recalculates and the new results display.
-
-
Click
 (Expanded View) to see the
expanded view. Click
  (Compressed View)
to compress the information.
 -
Click the minus sign next to the sections name to collapse it.
-
To limit the type of views, you have three buttons in the taskbar:
-
Click
 (All attributes) to see all
attributes of the sections you selected.
 -
Click
 (Attributes with different
values) to see only the attributes that are different across
the drifts.
 -
Click
 (Attributes with the same
values) to see only the attributes that are the same across
drifts.
-
The drift comparison displays. Download the data or create a report from your drift for analysis using external tools.
Creating a Drift Report for Hosts
Use the drift report feature to export information about your host’s drift.
-
Create the comparison to analyze.
-
Click
 (Download).
 -
Click the output button for the type of report you want.
-
Click
 (Download drift report in TXT
format) for a text file.
 -
Click
 (Download drift report in CSV
format) for a comma-separated file.
 -
Click
 (Download drift report in PDF
format) for a PDF file.
-
Virtual Machines
The heterogeneous virtual machine container and guest support combined with the ability to analyze information inside the virtual machine - such as disk space, patch level or installed applications - provides in-depth information across the virtual environment. This rich set of information enables ManageIQ users to improve problem resolution times and effectively manage virtual machines.
The Virtual Machines pages display all virtual machines that were discovered by your server. Note that if you have applied a filter to a user, it will be in effect here. The Virtual Machines taskbar is a menu driven set of buttons that provide access to functions related to virtual machines.
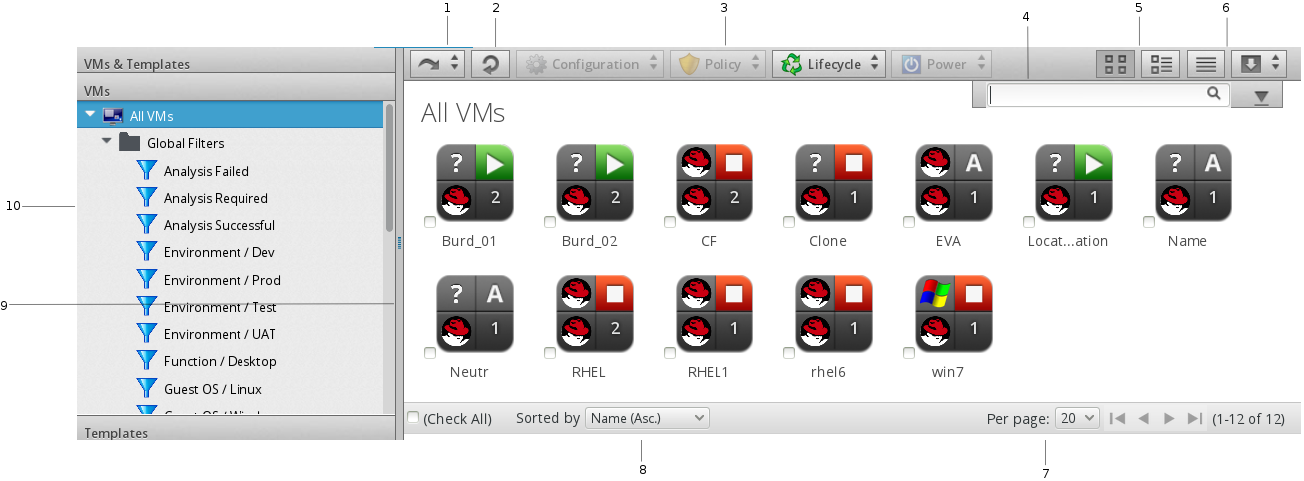
-
History button
-
Refresh screen button
-
Taskbar
-
Name search bar/Advanced Search button
-
View buttons
-
Download buttons
-
Navigation bar
-
Sort dropdown
-
Main area in Grid View
-
Provider/Filter Navigation
The console uses Virtual Thumbnails to describe virtual machines and templates. Each thumbnail contains four quadrants by default. This allows you to glance at a virtual machine for a quick view of its contents.

-
Top left quadrant: Operating system of the Virtual Machine
-
Bottom left quadrant: Virtual Machine Hosts software
-
Top right quadrant: Power state of Virtual Machine or Status icon
-
Bottom right quadrant: Number of Snapshots for this Virtual Machine
| Icon | Description |
|---|---|
 |
Template: Virtual Template |
 |
Retired: When a virtual machine or instance is no longer required, it can be retired. Once a virtual machine or instance reaches its retirement date and time, it is immediately shut down and not allowed to restart. If an attempt to restart is made, ManageIQ will shut down the virtual machine or instance. |
 |
Archived: An archived virtual machine has no host or datastore associated with it. Archiving is done to move virtual machines to a low cost storage, either on demand or during retirement, if requested, to avoid incurring extra cost on a virtualized infrastructure due to virtual machine sprawl. |
 |
Orphaned: An orphaned virtual machine has no host but has a datastore associated with it. Orphaned virtual machines are those that have been removed from their providers but still exist on the storage. An orphaned virtual machine is unable to identify the associated host. A virtual machine also shows as orphaned if it exists on a different host than the host expected by the provider’s server. |
 |
Disconnected: A disconnected virtual machine is one that has lost connection to either the provider’s storage, host, or both. A disconnect is usually a result of network issues on the provider side. For instance, if during virtual machine provisioning the storage is not set up or deleted, the virtual machine will still exist on the provider, but will not run on the host as it has lost connection to its provider’s storage. |
 |
On: Virtual Machine is powered on. |
 |
Off: Virtual Machine is powered off. |
 |
Suspended: Virtual Machine has been suspended. |
The Virtual Machines page has three accordions organizing your virtual machines and templates in different ways. All of these accordions share a set of common controls:
-
Use VMs and Templates to view your virtual machines and templates organized by Provider. In addition, you can see archived and orphaned items here.
-
Use VMs to view, apply filters, and collect information about all of your virtual machines.
-
Use Templates to view, apply filters, and collect information about all of your templates.
Through the console, you are able to view your virtual machines in multiple ways. For your virtual machines, you can:
-
Filter virtual machines
-
Change views
-
Sort
-
Create a report
-
Search by MyTags
-
Search by collected data
Filtering Virtual Machines and Templates
The Virtual Machine Filter accordion is provided so that you can easily navigate through groups of virtual machines. You can use the ones provided or create your own through Advanced Filtering capabilities.
-
Navigate to Compute > Infrastructure > Virtual Machines.
-
Go to the VMs or Templates accordion.
-
Click on the desired filter from the left pane.
Creating a Virtual Machine or Template Filter
-
Browse to menu: Compute > Infrastructure > Virtual Machines.
-
Go to the VMs or Templates accordion.
-
Click All VMs or All Templates, then click
 (Advanced Search) to open the
expression editor.
 -
Use the expression editor to choose the appropriate options for your criteria. Based on what you choose, different options will show.
-
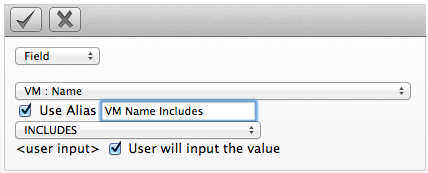
For all of the types of searches, you have the options of creating an alias and requested user input. Select Use Alias to create a user friendly name for the search. If you are requested user input for the search, this text will show in the dialog box where the input is requested.
-
Click Field to create criteria based on field values.
-
Click Count of to create criteria based on the count of something, such as the number of snapshots for a virtual machine, or the number of virtual machines on a host.

-
Click Tag to create criteria based on tags assigned to your virtual infrastructure, such as for power states or production tagging.

-
Click Registry to create criteria based on registry values, such as the DCOM status of a Windows system. Note this criteria applies only to Windows operating systems.

-
Click Find to seek a particular value, and then check a property.

-
-
Click
 (Commit Expression Element
Changes) to add the expression.
 -
Click Save.
-
Type in a name for the search expression in Save this VM search as. (Note that this title depends on the type of resource you are searching.) To set the filter to show globally, check Global search.
-
Click Save.
The filter is saved and will show in the My Filters area of the Filter accordion. If you checked Global search, the filter will show under Global Filters.
Loading a Report Filter or Search Expression
-
Browse to menu: Compute > Infrastructure > Virtual Machines.
-
Click the accordion for the items to search either VMs or Templates.
-
Click
 (Advanced Search) to open the
expression editor.
 -
Click Load.
-
Select either a saved virtual machine search or a virtual machine report filter.
Note:
The set of items to select will depend on the type of resource you are searching.

-
Click Load to load the search expression.
-
If you want to edit the expression, click on it and make any edits for the current expression.
-
Click
 (Commit expression element
changes) to add the changes.
 -
Click
 (Undo the previous change)
to remove the change you just made.
 -
Click
 (Redo the previous change)
to put the change that you just made back.
 -
Click
 (AND with a new expression
element) to create a logical AND with a new expression
element.
 -
Click
 (OR with a new expression
element) to create a logical OR with a new expression element.
 -
Click
 (Wrap this expression element
with a NOT) to create a logical NOT on an expression element
or to exclude all the items that match the expression.
 -
Click
 (Remove this expression
element) to take out the current expression element.
-
-
Click Load.
-
Click Apply.
Changing Views for Virtual Machines and Templates
While you can set the default view for different pages from the settings menu, then Configuration > My Settings > Default Views, the current view can also be controlled from the Virtual Machines pages.
-
Browse to menu: Compute > Infrastructure > Virtual Machines.
-
Click the accordion for the items to view.
-
Click the appropriate button for the desired view.
-
Click
 for Grid View.
 -
Click
 for Tile View.
 -
Click
 for List View.
-
Sorting Virtual Machines and Templates
Virtual machines and templates can be sorted by Name, Cluster, Host, Datastore, Compliance, Last Analysis Time, Total Snapshots, or Region.
-
Browse to menu: Compute > Infrastructure > Virtual Machines.
-
Click the accordion for the items to sort.
-
To sort virtual machines or templates when in grid or tile view:
- From the Sort by dropdown, click the attribute to sort.
-
To sort virtual machines or templates when in list view:
-
Select the List View.
-
Click on the Column Name to sort. For example, click on Cluster to sort by the name of the cluster.
-
Creating a Virtual Machine or Template Report
For a listing of virtual machines and templates, you can create a quick report in CSV, TXT, or PDF formats.
-
Browse to menu: Compute > Infrastructure > Virtual Machines.
-
Click the accordion for the items for report creation.
-
Click
 (Download).
-
Click
 for a TXT file.
 -
Click
 for a CSV file.
 -
Click
 for a PDF file.
-
Searching for Virtual Machines or Templates
To the right of the taskbar on the Virtual Machines page, you can enter names or parts of names for searching. You can search in the following ways:
-
Type characters that are included in the name. For example, if you type
sp1, all Virtual Machines whose names includesp1appear, such asWindows2003sp1andSp1clone. -
Use
*at the end of a term to search for names that begin with specific characters. For example, typev*to find all virtual machines whose names begin with the letterv. -
Use
\*at the beginning of a term to search for names that end with specific characters. For example, type*sp2to find all virtual machines whose names end withsp2. -
Erase all characters from the search box to go back to viewing all virtual machines.
Search for virtual machines or templates:
-
Browse to menu: Compute > Infrastructure > Virtual Machines.
-
Click the accordion for the items to search.

-
In the Name Filter bar in the upper right corner of the window, type your criteria.
-
Click
 (Search by Name within results)
or press Enter.
 -
Type in other criteria to filter on what is currently displayed.
-
Click
 (Search by Name within results)
or press Enter.
Analyzing Virtual Machines and Templates
Analyze a virtual machine to collect metadata such as user accounts, applications, software patches, and other internal information. If ManageIQ is not set up for automatic analysis, perform a manual analysis of a virtual machine. To perform a SmartState analysis, ManageIQ requires a running SmartProxy with visibility to the virtual machine’s storage location. If the virtual machine is associated with a host or provider, ensure the virtual machine is registered with that system to be properly analyzed; the server requires this information since a snapshot might be created.
Note:
SmartState Analysis of a virtual machine requires access to its host. To perform a successful analysis, edit the virtual machine’s host and enter the host’s authentication credentials.
-
Navigate to Compute > Infrastructure > Virtual Machines.
-
Click the accordion for the items to analyze.
-
Check the Virtual Machines and Templates to analyze.
-
Click
 (Configuration), then
 (Perform SmartState Analysis).
 -
Click OK.
Red Hat Enterprise Virtualization Prerequisites
SmartState Analysis on Red Hat Enterprise Virtualization Manager 3.1 and Above - Storage Support Notes
Note the following requirements when performing SmartState Analysis on Red Hat Enterprise Virtualization Manager 3.1 and above.
-
NFS
- The ManageIQ appliance requires a mount to the NFS datastore.
-
iSCSI / FCP
-
For Red Hat Enterprise Virtualization 3.1 and 3.2, clusters must use full Red Hat Enterprise Linux hosts and not Red Hat Enterprise Virtualization Hypervisor hosts. You can use either type of host in Red Hat Enterprise Virtualization 3.3 and above.
-
Each ManageIQ appliance performing SmartState Analysis requires sharable, non-bootable DirectLUN access to each attached iSCSI/FCP storage domain. In order to perform smart analysis, the appliance must mount the data storage as a DirectLUN disk.
-
A ManageIQ appliance must reside in each datacenter with the iSCSI / FCP storage type.
-
If your storage domain is using Logical Volume Manager (LVM), you will need to manually activate your volume groups and logical volumes before performing the SmartState Analysis.
- Edit the
/etc/lvm/lvm.conffile on the appliance and add volume groups to activate as read-only:activation { read_only_volume_list = ["volume_group_0", "volume_group_1", etc...] }Note: the volume group names are the storage domain UUIDs
- Activate volume groups:
vgchange -ay
- Edit the
-
-
Other Notes
-
The Edit Management Engine Relationship option enables the VM SmartState Analysis job to determine the datacenter where a ManageIQ appliance is running and thus to identify what storage it has access to in a Red Hat Enterprise Virtualization environment.
-
After setting up a ManageIQ appliance and performing a refresh of the provider, find the ManageIQ appliance in the Virtual Machine accordion list and view its summary screen.
-
Click Configuration > Edit Management Engine Relationship.
-
Select the server that relates to this instance of the ManageIQ appliance.
-
-
SmartState Analysis on Red Hat Enterprise Virtualization Manager 3.0 - Storage Support Notes
There are two additional steps required to perform a SmartState Analysis
on Red Hat Enterprise Virtualization Manager 3.0 using iSCSI or FCP
storage. NFS storage does not have these requirements.
-
Enable
DirectLUNsupport for the host and ManageIQ appliance that performs the analysis.-
Enable
DirectLUNon host. -
Enable
DirectLUNon the ManageIQ appliance. To do this, edit the desired Red Hat Enterprise Virtualization storage and get theLUNIDvalue. Then, on the ManageIQ appliance virtual machine in the Red Hat Enterprise Virtualization user interface, right-click and select Edit > Custom Properties and enter the following in the Custom Properties edit box:directlun=<LUN ID>:readonlyIf you have multiple storage domains, separate them by a comma, similar to:
directlun=<LUN ID 1>:readonly,<LUN ID 2>:readonly,<LUN ID N>:readonlyNote:
The ManageIQ appliance must reside in the same data center as the storage you are trying to connect. If you have multiple data centers with
iSCSIorFCPstorage, you need a ManageIQ appliance in each data center to support virtual machine scanning.
-
-
Set Server Relationship - This is required to allow the virtual machine SmartState analysis job to determine which data center a ManageIQ appliance is running and therefore identify what storage it has access to in a Red Hat Enterprise Virtualization environment.
-
After setting up a ManageIQ appliance and performing a refresh of the Provider, find the ManageIQ appliance in the Virtual Machine accordion list and view its summary screen.
-
Click
 (Configuration), and then
 (Edit Server Relationship).
 -
Select the server that relates to this instance of the ManageIQ appliance.
-
-
If your storage domain is using Logical Volume Manager (LVM), you will need to manually activate your volume groups and logical volumes before performing the SmartState Analysis.
- Edit the
/etc/lvm/lvm.conffile on the appliance and add volume groups to activate as read-only:activation { read_only_volume_list = ["volume_group_0", "volume_group_1", etc...] }Note: the volume group names are the storage domain UUIDs
- Activate volume groups:
vgchange -ay
For more information, please refer to the Red Hat Enterprise Linux documentation.
- Edit the
VMware vSphere Prerequisites
Installing VMware VDDK on appliances
Execution of SmartState Analysis on virtual machines within a VMware environment requires the Virtual Disk Development Kit (VDDK) to be installed.
To install VMware VDDK:
-
Download the required VDDK version (
VMware-vix-disklib-[version].x86_64.tar.gz) from the VMware website.Note:
-
If you do not already have a login ID to VMware, then you will need to create one. At the time of this writing, the file can be found by navigating to Downloads > vSphere. Select the version from the drop-down list, then click the Drivers & Tools tab. Expand Automation Tools and SDKs, and click Go to Downloads next to the VMware vSphere Virtual Disk Development Kit version. Alternatively, find the file by searching for it using the Search on the VMware site.
-
See VMware documentation for information about their policy concerning backward and forward compatibility for VDDK.
-
-
Download and copy the
VMware-vix-disklib-[version].x86_64.tar.gzfile to the/rootdirectory of the appliance. -
Start an SSH session into the appliance.
-
Extract and install the
VMware-vix-disklib-[version].x86_64.tar.gzfile using the following commands:# cd /root # tar -xvf VMware-vix-disklib-[version].x86_64.tar.gz # cp vmware-vix-disklib-distrib/ -rf /usr/lib/vmware-vix-disklib/ # ln -s /usr/lib/vmware-vix-disklib/lib64/libvixDiskLib.so /usr/lib/libvixDiskLib.so # ln -s /usr/lib/vmware-vix-disklib/lib64/libvixDiskLib.so.6 /usr/lib/libvixDiskLib.so.6 # ln -s /usr/lib/vmware-vix-disklib/lib64/libvixDiskLib.so.6.7.0 /usr/lib/libvixDiskLib.so.6.7.0 -
Run
ldconfigto verify that the application can find the newly installed VDDK library.Note:
Use the following command to verify the VDDK files are listed and accessible to the appliance:
# ldconfig -p | grep vix -
Restart the appliance.
The VDDK is now installed on the appliance. This enables use of the SmartState Analysis server role on the appliance.
Comparing Virtual Machines and Templates
The ManageIQ Server allows you to compare multiple virtual machines. This allows you to see how different virtual machines are from their original template. This helps detect missing patches, unmanaged user accounts, or unauthorized services.
Use the comparison feature to:
-
Compare multiple virtual machines from different hosts.
-
Compare multiple virtual machines side-by-side.
-
Quickly see similarities and differences among multiple virtual machines and a base.
-
Narrow the comparison display to categories of properties.
-
Print or export in the comparison results to a PDF or CSV file.
Compare virtual machines and templates:
-
Navigate to Compute > Infrastructure > Virtual Machines.
-
Click the accordion for the items to analyze.
-
Check the items to compare.
-
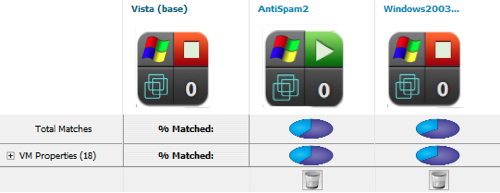
Click
 btn:[(Configuration)], and then
 btn:[(Compare Selected items)]. The
comparison displays in a compressed view with a limited set of
properties listed.
-
To delete an item from the comparison, click
 btn:[(Remove this item from Inventory)]
at the bottom of the items column. This option is only available
when comparing more than two virtual machines.
 -
To view many items on one screen, go to a compressed view by clicking
 btn:[(Compressed View)]. To
return to an expanded view, click
  btn:[(Expanded View)].
 -
To limit the mode of the view, there are two buttons in the task bar.
-
Click
 btn:[(Details Mode)] to see
all details for an attribute.
 -
Click
 btn:[(Exists Mode)] to limit
the view to if an attribute exists compared to the base or not.
This only applies to attributes that can have a boolean
property. For example, a user account exists or does not exist,
or a piece of hardware that does or does not exist.
-
-
To change the base virtual machine that all the others are compared to, click its label at the top of its column.
-
To go to the summary screen for a virtual machine, click its btn:[Virtual Thumbnail] or icon.
Virtual Machine and Templates Comparison Sections
The following table describes the different sections for comparison information.
| Section | Description |
|---|---|
| Properties | Use this section to see basic information on the file location of the virtual machine, its name, and the virtual machine monitor vendor. Hardware, disk, CD/DVD drives, floppy drive, network adapter, and volume information is also included. |
| Security | Use this to see users and groups for the virtual machine, including those which may be unauthorized compared to a template. |
| Configuration | Use this to see Guest Applications, Win32 services, Linux Init Processes, Kernel Drivers, File System Drivers, and Patches. |
| My Company Tags | Use this to see all tags. |
Using the Virtual Machine Comparison Sections
Use the comparison sections to view various comparison data and display the data in different ways.
-
On the left of a comparison screen, select what categories of properties to display.
-
Click Apply.
-
Click the plus sign next to the sections name to expand it.
-
The following descriptions pertain to the Expanded View
 . Whether you see the value of a property
or an icon representing the property depends on the properties type.
. Whether you see the value of a property
or an icon representing the property depends on the properties type.-
A property displayed in the same color as the base means that the compared virtual machine matches the base for that property.
-
A property displayed in a different color from the base means that the compared virtual machine does not match the base for that property.
-
-
If you are in the Compressed View
 , the
values of the properties will not be displayed. The icons shown
below will describe all items.
, the
values of the properties will not be displayed. The icons shown
below will describe all items.-
A
 (checkmark) means that the
compared virtual machine matches the base for that property. If
you hover over it, the value of the property will display.
 -
A
 (x) means that the compared
virtual machine does not match the base for that property. If
you hover over it, the value of the property will display.
-
-
Click the minus sign next to the sections name to collapse it.
Your comparison can be viewed in multiple ways. Export the data or create a report from your comparison for analysis using external tools.
Creating a Virtual Machine Comparison Report
Output the data from a comparison report in TXT, CSV or PDF formats.
-
Create the comparison for the report.
-
Click the output button for the chosen report type.
-
Click
 (Download comparison report in
TXT format) for a text file.
 -
Click
 (Download comparison report in
CSV format) for a CSV file.
 -
Click
 (Download comparison report in
PDF format) for a PDF file.
-
Controlling the Power State of Red Hat Virtualization Virtual Machines
Follow this procedure to control the power states of Red Hat Virtualization VMs through the ManageIQ console.
-
Navigate to Compute > Infrastructure > Virtual Machines.
-
Click on a VM to change the power state.
-
Click Power Operations, then click the button for the desired power operation. Available operations will depend on the current power state of the VM.
-
Click
 (Shutdown Guest) to shutdown
the guest OS on the VM.
 -
Click
 (Restart
Guest) to restart the guest OS on the VM.
 -
Click
 (Power On) to power on the
VM.
 -
Click
 (Power Off) to power off the
VM.
 -
Click
 (Suspend) to suspend the VM.
 -
Click
 (Reset) to reset the VM.
-
-
Click OK.
Refreshing Virtual Machines and Templates
Refresh your virtual machines to get the latest data the provider or host can access. This includes information such as the power state, container, and hardware devices attached to the virtual machine.
-
Browse to menu: Compute > Infrastructure > Virtual Machines.
-
Click the accordion for the items to analyze.
-
Check the items to refresh.
-
Click Configuration, and then
 (Refresh Relationships and Power
States) on the Virtual Machine Taskbar.
The console returns a refreshed list of the data associated with the selected virtual machines.
Extracting Running Processes from Virtual Machines and Templates
ManageIQ can collect processes running on Windows virtual machines. To do this, enter domain credentials for the zone where the virtual machine is located.
The virtual machine must be running and must have an IP address in the VMDB, usually obtained from a SmartState Analysis.
-
Browse to menu: Compute > Infrastructure > Virtual Machines.
-
Check the Virtual Machines to collect the processes.
-
Click Configuration, and then
 (Extract Running Processes) on the
Taskbar.
 -
Click OK.
The server returns the running processes. View the summary of the virtual machine to see the details.
Setting Ownership for Virtual Machines and Templates
You can set the owner of a group of virtual machines and templates by either individual user or group. This allows you an additional way to filter and can be used to enforce quotas.
-
Browse to menu: Compute > Infrastructure > Virtual Machines.
-
Click the accordion for the items to change.
-
Check the items to set ownership.
-
Click Configuration, and then
 (Set Ownership) on the Virtual
Machine Taskbar.
 -
From the Select an Owner dropdown, select a user, and from the Select a Group dropdown, select a group.

-
Click Save.
Removing Virtual Machines and Templates from the VMDB
If a virtual machine has been decommissioned or you need to perform some troubleshooting, you might need to remove a specific virtual machine from the VMDB. This does not however remove the virtual machine or template from its Datastore or Provider.
-
Browse to menu: Compute > Infrastructure > Virtual Machines.
-
Click the accordion for the items to remove.
-
Check the items to remove.
-
Click Configuration, and then
 (Remove from the VMDB) button.
 -
Click OK.
Tagging Virtual Machines and Templates
-
Browse to menu: Compute > Infrastructure > Virtual Machines.
-
Click the accordion for the items to tag.
-
Check the items to tag.
-
Click
 (Policy), and then
 (Edit Tags).
 -
Select a customer tag from the first dropdown, and then a value for the tag.

Viewing a VMware Virtual Machine’s Storage Profile
VMware storage profiles allow you to assign policies to datastores. Storage profiles are used to tag virtual machines to ensure they operate in compliance with settings in the datastore.
ManageIQ retrieves VMware virtual machine storage profile information in the inventory, and associates the virtual machines and disks with them.
To view a virtual machine’s storage profile:
-
Browse to menu: Compute > Infrastructure > Virtual Machines.
-
Click a VMware virtual machine to open its summary page.
-
The VMware Storage Profile is listed under Properties.
You can assign a storage profile when provisioning a VMware virtual machine in ManageIQ, by using the virtual machine as a template to clone. See Provisioning Virtual Machines in Provisioning Virtual Machines and Hosts for instructions.
Viewing Running Processes after Collection
-
Click a virtual machine with collected processes.
-
From the Diagnostics area, click Running Processes.
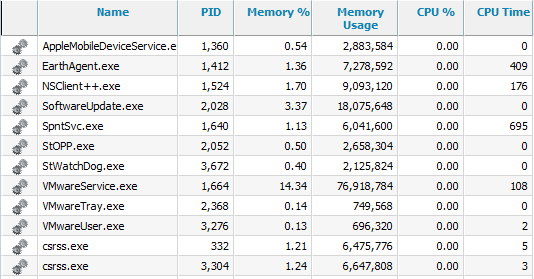
The most recent collection of running processes is displayed. Sort this list by clicking on the column headers.
Editing Virtual Machine or Template Properties
Edit the properties of a virtual machine or template to set parent and child virtual machines. SmartState Analysis also can detect this.
-
Browse to menu: Compute > Infrastructure > Virtual Machines.
-
Click the accordion for the items to edit.
-
Click the item to edit properties.
-
Click Configuration, and then
 (Edit selected item) on the Taskbar.
 -
From the Parent VM dropdown, select the parent virtual machine.
-
From Child VM selection, select virtual machines that are based on the current virtual machine from the list of Available VMs.
-
Click Save.
Setting Ownership of a Virtual Machine or Template
Set the owner of a virtual machine or template by either individual user or group. This allows you an additional way to filter configuration items.
-
Browse to menu: Compute > Infrastructure > Virtual Machines.
-
Click the accordion for the items to analyze.
-
Click the item to set ownership.
-
Click Configuration, and then
 (Set Ownership) on the taskbar.
 -
From the Select an Owner dropdown, select a user.

-
From the Select a Group dropdown, select a group.
-
Click Save.
Right Sizing a Virtual Machine
ManageIQ uses collected statistics to recommend the best size for a virtual machine. ManageIQ uses the information from the Normal Operating Range to calculate the recommendations.
-
Browse to menu: Compute > Infrastructure > Virtual Machines.
-
Click a virtual machine for right-sizing.
-
Click Configuration, and then
 (Right-Size Recommendations) button.
A new page appears with three levels of Memory and CPU recommendations, Conservative, Moderate, and Aggressive, next to the Normal Operating Range statistics.
Viewing Capacity and Utilization Charts for a Virtual Machine
You can view capacity and utilization data for virtual machines that are part of a cluster. Note that daily charts only include full days of data. If all 24 data points for a day are not available, daily charts are not displayed. For some capacity and utilization data, ManageIQ calculates and shows trend lines in the charts which are created using linear regression. The calculation uses the capacity and utilization data collected by ManageIQ during the interval you specify.
Note:
You must have a server with network visibility to your provider assigned the server role of Capacity & Utilization Collector to use this feature.
The virtual machine must be powered on to collect the data.
-
From Compute > Infrastructure > Virtual Machines, click the accordion that you want to view capacity data for.
-
Click the item you want to view.
-
Click
 (Monitoring), and then
 (Utilization).
 -
From Interval, select to view Daily, Hourly, or Most Recent Hour data points. When choosing Daily, you can also select the Date, and how far back you want to go from that date. When selecting Hourly, you can select the date for which you want to view hourly data. If you are using Time Profiles, you will be able to select that as an option, also.
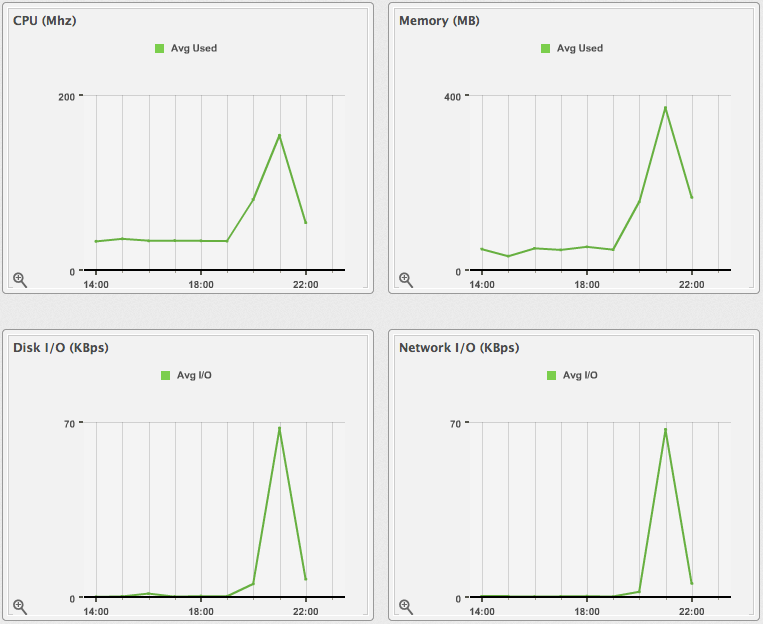
-
From Compare to, select Parent Host or Parent Cluster. The capacity and utilization charts for both items will show simultaneously.
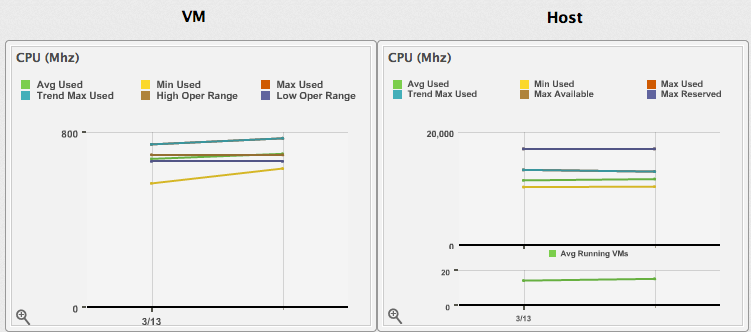
Note:
Daily charts only include full days of data. This means ManageIQ does not show daily data for a day without a complete 24 data point range for a day.
For information about data optimization including utilization trend reports, see Data Optimization.
Viewing the Virtual Machine or Template Timeline
View the timeline of events for a virtual machine or template if registered to a Host.
-
Browse to menu: Compute > Infrastructure > Virtual Machines.
-
Click the virtual machine to view the timeline.
-
Click
 (Monitoring), and then
 (Timelines) on the taskbar.
 -
From Options, customize the period of time to display, and the types of events to view.

-
Use the Interval dropdown to select hourly or daily data points.
-
Use Date to type the date of the timeline to display.
-
If viewing a daily timeline, use Show to set how many days back to go. The maximum history is 31 days.
-
The three Event Group dropdowns allow selection of different event groups to display. Each has its own color.
-
From the Level dropdown, select either a Summary event or a Detail list of events. For example, the detail level of a Power On event might include the power on request, the starting event, and the actual Power On event. If you select Summary, you only see the Power On event in the timeline.
-
-
To see more detail on an item in the timeline, click on it. A balloon appears with a clickable link to the resource.
Virtual Machine or Template Summary
When you click on a specific virtual machine or template, you will see the Virtual Thumbnail, and an operating system-specific screen of the item, called the Summary. Where applicable, click on a subcategory of the Summary to see more detail on that section.
Note:
When you perform a SmartState Analysis on a virtual machine or template, you get more detailed information in these categories.
-
Properties include information such as the base operating system, hostname, IP addresses, Virtual Machine vendor, CPU Affinity, devices attached to the system, and snapshots. This includes the ability to analyze multiple partitions, multiple disks, Linux logical volumes, extended partitions, and Windows drives. Some categories can be clicked on for additional detail. For example, click Container to view notes associated with a virtual machine.
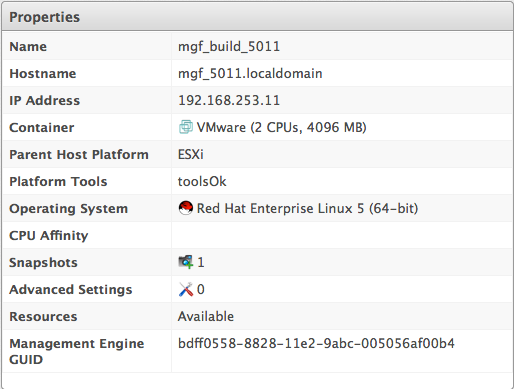
-
Lifecycle shows the date of discovery and the last analysis. If a retirement date and time or owner has been set, these display as well.
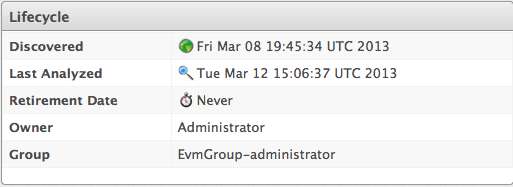
-
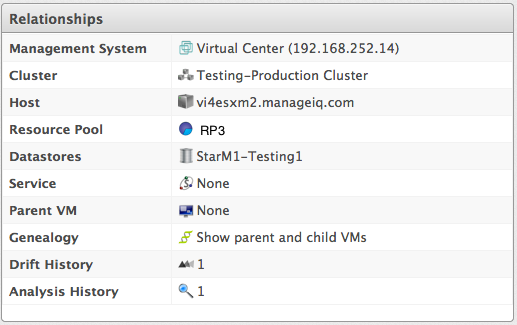
Relationships include information on the parent host, genealogy such as parent and child virtual machines, and drift.
-
Storage Relationships shows relationships to Filers, LUNs, Volumes and File Shares.
-
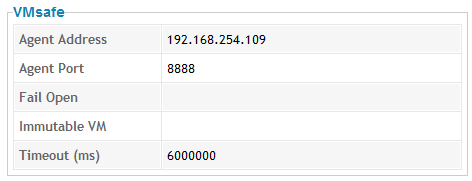
VMsafe shows properties of the VMsafe agent if it is enabled.
-
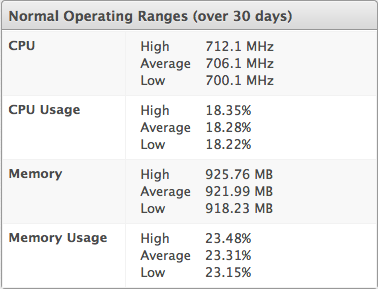
Normal Operating Ranges shows the values for the normal operating range for this virtual machine. These statistics are used in calculating right sizing recommendations.
-
Power Management displays the current power state, last boot time, and last power state change. State Changed On is the date that the virtual machine last changed its power state. This is a container view of the power state, therefore a restart of the operating system does not cause the container power state to change and will not update this value.

-
Security includes information on users, groups, and security patches. Recall that the items shown on the Summary screen change based on the guest operating system.

-
Configuration includes information on applications, services, packages, and init processes. This section changes depending on the base operating system.

-
Datastore Allocation Summary shows how many and how much disk space has been allocated to this virtual machine as well as disk alignment and thin provisioning information.
-
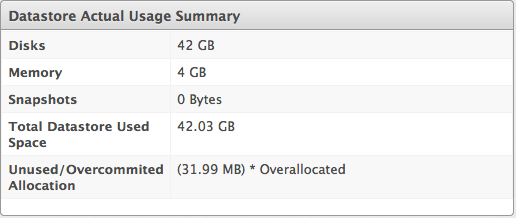
Datastore Actual Usage Summary shows how much disk and memory the virtual machine is actually using.
-
Diagnostics provides a link to viewing running processes and the information from the latest collected event logs.
-
Smart Management shows all tags assigned to this virtual machine.
Viewing the Operating System Properties
View details of the operating system from the Virtual Machine Summary or the accordion. For Windows systems, see Account Policies for the virtual machine.
-
From Compute > Infrastructure > Virtual Machines, click on the item to view its Summary.
-
From the Properties section, click Operating System.
An expanded view of the operating systems properties and Account Policies displays. This varies based on the operating system.
Viewing Virtual Machine or Template Snapshot Information
View the list of snapshots to see a history of their creation and size. ManageIQ provides the description, size, and creation time of the snapshot as well as a view of the genealogy of the snapshots.
Note:
Snapshot size is only available after the successful completion of a SmartState Analysis.
-
Browse to menu: Compute > Infrastructure > Virtual Machines.
-
Click the appropriate accordion containing the item you wish to view the snapshots of.
-
Click on the item to view its Summary.
-
From the Summary, click Snapshots in the Properties area.
-
The list of snapshots show in a tree format and captures their genealogy.
Viewing User Information for a Virtual Machine or Template
ManageIQ’s SmartState Analysis feature returns user information. Drill into the user to get details on the user’s account, including group memberships.
-
Browse to menu: Compute > Infrastructure > Virtual Machines.
-
Click the accordion for the item to view user information.
-
Click on the item to view its Summary.
-
From the Security section of the Virtual Machine Summary, click Users.
-
Click the user to view details.
Viewing Group Information for a Virtual Machine or Template
ManageIQ’s SmartState Analysis feature returns group information. Explore a group to get a list of its users.
-
Browse to menu: Compute > Infrastructure > Virtual Machines.
-
Click the accordion for the item to view user information.
-
Click on the item to view its Summary.
-
From the Security section of the Virtual Machine Summary, click Groups.
-
Click the group to view users.
Viewing Genealogy of a Virtual Machine or Template
ManageIQ detects the lineage of a virtual machine. View a virtual machine’s lineage and compare the virtual machines that are part of its tree. This also allows tagging of virtual machines that share genealogy.
-
Browse to menu: Compute > Infrastructure > Virtual Machines.
-
Click the accordion for the item to view genealogy.
-
Click on the item to view its Summary.
-
From the Relationships area in the Summary, click Genealogy.
Comparing Genealogy of a Virtual Machine or Template
-
Browse to menu: Compute > Infrastructure > Virtual Machines.
-
Click the accordion for the item to view genealogy.
-
Click on the item to view its Summary.
-
From the Relationships area in the Summary, click Genealogy.
-
Check the items to compare.
-
Click
 (Compare Selected VMs).
Tagging Virtual Machines or Templates with a Common Genealogy
-
Browse to menu: Compute > Infrastructure > Virtual Machines.
-
Click the accordion for the item to view genealogy.
-
Check the items to tag.
-
Click
 (Policy), and then
 (Edit Tags).
 -
Select a customer tag from the first dropdown, and then a value for the tag.

Detecting Drift on Virtual Machines or Templates
The configuration of a virtual machine might change over time. Drift is the comparison of a virtual machine to itself at different points in time. The virtual machine needs analysis at least twice to collect this information. Detecting drift provides you the following benefits:
-
See the difference between the last known state of a machine and its current state.
-
Review the configuration changes that happen to a particular virtual machine between multiple points in time.
-
Review the host and datastore association changes that happen to a particular virtual machine between multiple points in time.
-
Review the classification changes that happen to a virtual machine between two time checks.
-
Capture the configuration drifts for a single virtual machine across a time period.
Detect drift on virtual machines or templates:
-
Browse to menu: Compute > Infrastructure > Virtual Machines.
-
Click on the item to view its Summary.
-
From the Relationships area in the Summary, click Drift History.
-
Check the analyses to compare.
-
Click
 (Select up to 10 timestamps for
Drift Analysis) at the top of the screen. The results display.
 -
Check the Drift sections on the left to view in your comparison.
-
Click Apply.
-
The following descriptions pertain to the Expanded View
 . Whether you see the value of a property
or an icon representing the property depends on the properties type.
. Whether you see the value of a property
or an icon representing the property depends on the properties type.-
A property displayed in the same color as the base means the compared analysis matches the base for that property.
-
A property displayed in a different color from the base means the compared analysis does not match the base for that property.
-
-
If you are in the Compressed View
 , the
values of the properties are not displayed. All items are described
by the icons shown below.
, the
values of the properties are not displayed. All items are described
by the icons shown below.-
A
 (checkmark) means that the
compared analysis matches the base for that property. If you
hover over it, the value of the property will display.
 -
A
 (triangle) means the compared
analysis does not match the base for that property. If you hover
over it, the value of the property displays. Click the minus
sign next to the sections name to collapse it.
-
-
To limit the scope of the view, you have three buttons in the Resource button area.
-
Click
 (All attributes) to see all
attributes of the sections you selected.
 -
Click
 (Attributes with different
values) to see only the attributes that are different across
the drifts.
 -
Click
 (Attributes with the same
values) to see only the attributes that are the same across
drifts.
-
-
To limit the mode of the view, there are two buttons in the Resource button area.
-
Click
 (Details Mode) to see all
details for an attribute.
 -
Click
 (Exists Mode) to only see if
an attribute exists compared to the base or not. This only
applies to attributes that can have a Boolean property. For
example, a user account exists or does not exist, or a piece of
hardware that does or does not exist.
-
This creates a drift analysis. Download the data or create a report from your drift for analysis using external tools.
Creating a Drift Report for a Virtual Machine or Template
-
Create the comparison to analyze.
-
Click
 (Download).
 -
Click the output button for the type of report you want.
-
Click
 (Download drift report in text
format) for a text file.
 -
Click
 (Download drift report in CSV
format) for a csv file.
 -
Click
 (Download drift report in PDF
format) for a PDF file.
-
Viewing Analysis History for a Virtual Machine or Template
Each time a SmartState Analysis is performed on a virtual machine, a record is created of the task. This information is accessed either from the virtual machine accordion or the virtual machine summary. Use this detail to find when the last analysis was completed and if it completed successfully. If the analysis resulted in an error, the error is shown here.
-
Browse to menu: Compute > Infrastructure > Virtual Machines.
-
Click the accordion for the item to view genealogy.
-
Click on the item to view its Summary.
-
From the Relationships area in the Summary, click Analysis History. A history of up to the last 10 analyses is displayed.

-
Click on a specific analysis to see its details.
Viewing Disk Information for a Virtual Machine or Template
Each time a SmartState Analysis is performed on a virtual machine or template, information on the disks associated with the item is collected. This includes free and used space information as well as the type of disk and file system.
-
Browse to menu: Compute > Infrastructure > Virtual Machines.
-
Click on the item to view its Summary.
-
From Datastore Allocation Summary, click Disks.
A list of the disks for the item with type, file system, size, and usage information is displayed.
Reconfiguring Virtual Machines
Memory, processors, disks, ISOs, and CD/DVD Drives can be reconfigured on existing VMware and Red Hat Virtualization virtual machines using the Reconfigure this VM button.
You can reconfigure multiple components on a virtual machine using one request, or make each reconfiguration separately. Confirm your changes using the Submit button.
Adding a Disk to a Virtual Machine
A disk can be added to a VMware or Red Hat Virtualization virtual machine with the following steps:
-
Browse to menu: Compute > Infrastructure > Virtual Machines.
-
Select the target virtual machine.
-
Click Configuration, and then
 (Reconfigure this VM).
 -
Click Add Disk.
-
Specify the disk type, mode, size, and dependency options.
-
Click Submit.
After the disk has been added, you can view the new disk by navigating to Compute > Infrastructure > Virtual Machines. . Open the target virtual machine, then click Devices to view the new disk.
Removing a Virtual Machine Disk
A disk can be removed from a VMware or Red Hat Virtualization virtual machine with the following steps:
-
Browse to menu: Compute > Infrastructure > Virtual Machines.
-
Select the target virtual machine.
-
Click Configuration, and then
 (Reconfigure this VM).
 -
Click Delete next to the disk to remove.
-
Click Submit.
Resizing a Virtual Machine Disk
Note:
This functionality is available on VMware virtual machines only.
You can extend a VMware virtual machine’s disk with the following steps:
-
Browse to menu: Compute > Infrastructure > Virtual Machines.
-
Select the target virtual machine.
-
Click Configuration), and then
 (Reconfigure this VM).
 -
Click Resize next to the disk you want to resize to show resizing options.
-
Specify the desired memory size and units (MB or GB). A disk can only be extended in size.
-
Click Confirm Resize to select the values. Alternatively, selecting Cancel Resize shows the original values.
-
Click Submit.
The disk resizing request is then processed for the virtual machine.
Increasing or Decreasing a Virtual Machine’s Memory Size
You can increase or decrease a VMware or Red Hat Virtualization virtual machine’s memory size with the following steps:
-
Browse to menu: Compute > Infrastructure > Virtual Machines.
-
Select the target virtual machine.
-
Click Configuration, and then
 (Reconfigure this VM).
 -
Select Yes next to Memory to show memory options.
-
Specify the desired memory size and units (MB or GB).
-
Click Submit.
The memory add request is then processed for the virtual machine.
Reconfigure a Virtual Machine’s Processors
You can reconfigure a VMware or Red Hat Virtualization virtual machine’s processors with the following steps:
-
Browse to menu: Compute > Infrastructure > Virtual Machines.
-
Select the target virtual machine.
-
Click Configuration, and then
 Reconfigure this VM.
 -
Select Yes next to Processors to show processor options.
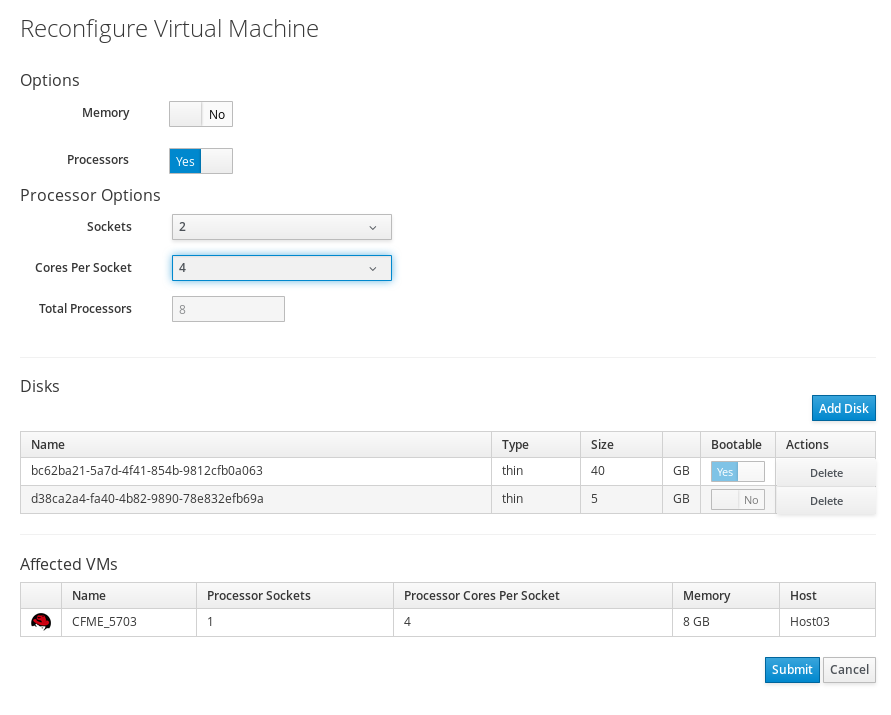
-
Specify the number of sockets and the number of cores per socket. The reconfiguration screen will calculate the Total Processors.
-
Click Submit.
The virtual machine’s processors are then reconfigured.
Adding or Removing Virtual Machine Network Adapters
Note:
This functionality is available on VMware virtual machines only.
You can add or remove network adapters on a VMware virtual machine from the Reconfigure this VM button.
Adding a Network Adapter to a VMware Virtual Machine
To add a network adapter to a virtual machine:
-
Browse to menu: Compute > Infrastructure > Virtual Machines.
-
Select the target virtual machine.
-
Click Configuration, and then
 (Reconfigure this VM).
 -
Click Add Network next to the disk you want to resize to show resizing options.
-
Select the type of adapter from the list under vLan.
-
Click Confirm Add.
-
Click Submit.
A request to add the network adapter is then processed for the virtual machine. You can view the details for the new network adapter by navigating to the Reconfigure this VM area. When the network adapter is added, a name and MAC address are assigned to the adapter.
Removing a Network Adapter from a VMware Virtual Machine
To remove a network adapter from a virtual machine:
-
Browse to menu: Compute > Infrastructure > Virtual Machines.
-
Select the target virtual machine.
-
Click Configuration, and then
 (Reconfigure this VM).
 -
Click Delete next to the network adapter you want to remove.
-
Click Submit.
Attach or Remove an ISO (VMware Virtual Machines Only)
You can attach an ISO to a VMware virtual machine using following steps:
-
Browse to menu: Compute > Infrastructure > Virtual Machines.
-
Select the target virtual machine.
-
Click Configuration, and then
 (Reconfigure this VM).
 -
Under CD/DVD Drives, click Connect.
-
Select the Host File from the list to attach and click Confirm Connect.
-
Click Submit.
The ISO is now attached to the VMware virtual machine.
You can remove an ISO on VMware virtual machine using following steps:
-
Browse to menu: Compute > Infrastructure > Virtual Machines.
-
Select the target virtual machine.
-
Click Configuration, and then
 (Reconfigure this VM).
 -
Under CD/DVD Drives, locate the Host File and click Disconnect.
-
Click Confirm.
-
Click Submit.
The ISO is removed from the VMware virtual machine.
Viewing Event Logs for a Virtual Machine or Template
Using an Analysis Profile, collect event log information from your virtual machines.
Note:
This feature is only available for Windows.
-
Browse to menu: Compute > Infrastructure > Virtual Machines.
-
Click the accordion for the item to view event logs.
-
Click on the item to view its Summary.
-
From Diagnostics click Event Logs.
The collected event log entries are displayed. Sort this list by clicking on the column headers.
Remote Consoles
A console is a graphical window that allows you to view the start up screen, shut down screen, and desktop of a virtual machine, and to interact with that virtual machine in a similar way to a physical machine.
ManageIQ offers the following support for HTML5-based VNC, SPICE, and WebMKS consoles:
-
VNC and SPICE consoles for Red Hat Virtualization Manager with websocket proxy.
-
VMware’s WebMKS HTML5-based console type.
-
VNC consoles for OpenStack using OpenStack-supplied websocket proxy.
Note:
-
VMware no longer supports the MKS console type. Also, VMRC is no longer a browser plugin but a native desktop application. As a result, the VMware MKS and the VMRC plugin options have been disabled in ManageIQ.
-
Currently, attempting to connect to the VMware WebMKS console for a virtual machine fails when the server security type is set to
2for that virtual machine. -
Due to VMware licensing restrictions, ManageIQ cannot ship the WebMKS SDK in ManageIQ. For information on how to configure WebMKS support in ManageIQ, see Configuring VMware WebMKS Support.
All of the above make use of the websocket protocol supported by all recent versions of browsers, and can use SSL to encrypt the websocket connection.
-
OpenStack ManageIQ only makes an API call to get the URL for the console and open that console in a web browser; see Directly Connect to a VNC Console in the Red Hat OpenStack Platform Instances and Images Guide for more details.
-
Red Hat Enterprise Virtualization Manager and VMware By default, the websocket connection runs over HTTPS or HTTP based on how the application was accessed. Under an appliance, you will most likely use HTTPS, and, therefore, the websocket connection will be wss:// (websocket with SSL).
When configuring Red Hat Virtualization Manager for virtual machine console access, set the display type for each virtual machine to
noVNCorSPICE HTML5. For more information on configuring console options, see Configuring Console Options in the Red Hat Virtualization Virtual Machine Management Guide.
Configuring Console Access to VMware ESXi Hosts At A Network Layer
When configuring access to the VNC or HTML5 console, make sure that at a network layer:
-
All VNC ports (5900-6000) are opened from the machine on which you access the ManageIQ Console to the ManageIQ.
-
All VNC ports (5900-6000) are opened from the ManageIQ to each VMware ESXi host running virtual machines that you want to access.
-
The firewall on VMware ESXi hosts is enabled and that the VMware ESXi host firewall ports are opened.
-
The VNC service (
gdbserver) is running and that thegdbserverservice has an association with ports 5900-6000 usually defined with a/etc/vmware/firewall/service.xmlfirewall rules configuration.The
gdbserverruleset must be enabled on each ESXi host running virtual machines that will be accessed through the HTML5 console or VNC console on the ManageIQ. The ruleset can be configured on the host itself, or using the VMware vCenter web user interface.
The following procedures apply to VMware vCenter 5.0 and later.
Using SSH to Configure VMware ESXi Hosts to Enable Console Access
Configure the gdbserver ruleset on the host using SSH.
-
Access the host:
# ssh host@example.com -
Set the
gdbserverparameter:# esxcli network firewall ruleset set --ruleset-id gdbserver --enabled true -
Confirm that the ruleset is active:
# esxcli network firewall ruleset list
Using the VMware vCenter Web Interface to Configure ESXi Hosts to Enable Console Access
Configure the gdbserver ruleset on the host using the VMware vCenter
web user interface.
-
Select the ESXi host in the VMware vCenter web interface.
-
Click the Manage tab.
-
Click the Settings sub tab.
-
Click System > Security Profile from the list on the left.
-
Click Edit.
-
Select the
gdbserverruleset, and then click OK.
Configuring the VMware ESXi Host Firewall Ports for Console Access
Follow these steps to configure the VMware ESXi host firewall ports for HTML5 or VNC console access to guest virtual machine consoles. The firewall ports must be enabled on each VMware ESXi host running virtual machines that will be accessed through the HTML5 or VNC console on the ManageIQ.
-
Log in to your vSphere Client and select Home > Inventory > Hosts and Clusters.
-
In the Hosts/Clusters tree view, select the VMware ESXi host you want to configure for HTML5 or VNC console access.
-
Select the Configuration tab and open the Software box.
-
Select Security Profile.
-
Browse to the Firewall Properties dialog window by selecting the Properties link from the Firewall section.
-
In the Firewall Properties, scroll down to GDB Server and select it.
-
Click OK.
Installing VMware WebMKS on appliances
VMware vSphere Virtual Machine Remote console access requires the installation of the VMware WebMKS SDK. Due to license restrictions this SDK cannot be built in to ManageIQ
-
Log in to the ManageIQ user interface appliance console as the root user.
-
On the ManageIQ user interface appliances, create a folder titled
webmksin the/var/www/miq/vmdb/public/directory./var/www/miq/vmdb/public/webmks -
Download and extract the contents of VMware WebMKS SDK into the
webmksfolder.
Opening a Console for a Virtual Machine
Open a web-based VNC or SPICE console for a virtual machine.
-
Browse to menu: Compute > Infrastructure > Virtual Machines.
-
Click on the virtual machine that you want to access.
-
Click
 (Access) and select VM
Console or Web Console.
The virtual machine console opens in a new tab in your browser.
Managing Virtual Machine Snapshots
A snapshot is a view of a virtual machine’s operating system and applications on any or all available disks at a given point in time. Take a snapshot of a virtual machine before you make a change to it that may have unintended consequences. You can use a snapshot to return a virtual machine to a previous state.
View virtual machines by infrastructure providers by navigating to Compute > Infrastructure > Providers.
Creating a Virtual Machine Snapshot
To create a snapshot of a virtual machine:
-
Browse to menu: Compute > Infrastructure > Virtual Machines.
-
Select the target virtual machine, and open it to view its details.
-
Under Properties, click Snapshots to show information about the virtual machine’s snapshots.
-
Click
 (Create a new snapshot
for this VM).
 -
Enter snapshot details in Description.
-
(Optional) Select Snapshot VM memory for the snapshot to preserve the virtual machine’s current runtime state. This option will appear only if the VM Power State is
 (On).
(On). -
Click Create.
Deleting a Virtual Machine Snapshot
To delete a virtual machine snapshot:
-
Browse to menu: Compute > Infrastructure > Virtual Machines.
-
Select the target virtual machine, and open it to view its details.
-
Under Properties, click Snapshots to show information about the virtual machine’s snapshots.
-
Select the snapshot to delete under Available Snapshots.
-
Click
 and select Delete Selected
Snapshot.
 -
Click OK.
Reverting a Virtual Machine to a Snapshot
A virtual machine can be reverted to a previous state using a snapshot.
To revert a virtual machine to a snapshot:
-
Power the virtual machine off.
-
Browse to menu: Compute > Infrastructure > Virtual Machines.
-
Select the target virtual machine, and open it to view its details.
-
Under Properties, click Snapshots to show information about the virtual machine’s snapshots.
-
Select the snapshot to revert to under Available Snapshots.
-
Click
 (Revert to selected snapshot).
 -
Click OK.
Creating a Template Based on a Virtual Machine
A template is a copy of a virtual machine (VM) that you can use to simplify the subsequent, repeated creation of similar VMs. Templates capture the configuration of software, configuration of hardware, and the software installed on the VM on which the template is based.
Note:
Virtual machines must meet the following criteria to publish as templates:
-
The VM must not be blank, archived or orphaned.
-
The VM must be associated with a oVirt / RHV provider.
-
oVirt / RHV provider 4.0 or higher, with
use_ovirt_engine_sdkset totruein/var/www/miq/vmdb/config/settings.ymlon your ManageIQ appliance. -
The VM power state is
OFF. -
Sealing a template is not supported for Windows OS VMs.
To create a template based on an existing VM:
-
Browse to menu: Compute > Infrastructure > Providers.
-
Click on a oVirt / RHV provider.
-
Select a VM.
-
Click
 (Lifecycle), then click
 (Publish
selected VM to a Template).
 -
Under the Request tab, provide Request Information and identify a Manager:
-
Enter an E-Mail address.
-
Provide a First and Last name in the individual fields.
-
Enter a Manager name.
-
-
Assign tags to the new template in the Purpose tab.
- Click on a tag category and check applicable tags.
-
Use fields in the Catalog tab to identify the source VM and provide details for the template:
-
Select the source VM from the Name field.
-
(Optional) Check Seal Template.
Note:
Sealing, which uses the
virt-sysprepcommand, removes system-specific details from a virtual machine before creating a template based on that VM. This prevents the original VM’s details from appearing in subsequent VMs that are created using the same template. It also ensures the functionality of other features, such as predictable vNIC order. -
The Number of VMs indicates the output will be a single template.
-
Provide a Name and Description for the created template.
-
-
Under the Environment tab, specify information for the storage domain in which to create the template’s disks.
-
Check Choose Automatically to allow ManageIQ to determine the destination cluster and datastore.
Or, manually enter cluster and datastore information using the following steps:
-
Select the cluster with which to associate the template from the Cluster list. By default, this is identical to the cluster of the source VM.
-
Choose a Datastore for the destination to create the template’s disks.
-
-
Provide provisioning and retirement information for VMs based on the template in the Schedule tab.
-
Select Schedule or Immediately on Approval for Schedule Info to determine when to provision the VM.
-
Set the Time to Retirement under Lifespan using the drop-down menu.
-
-
Click Submit.
Retiring Virtual Machines
Specify a retirement date and time for virtual machines or instances using ManageIQ.
To set retirement date and time:
-
Browse to menu: Compute > Infrastructure > Virtual Machines.
-
Select the virtual machines or instances for retirement.
-
Click
 (Lifecycle), then select
Set Retirement Date.
 -
Under Enter Retirement Date as, select Specific Date and Time.
-
Select a date using the calendar control, then click
 (Select Time).
 -
Specify the hour and minute for retirement.
-
Select a Retirement Warning from the list.
-
Click Save.
Migrating Virtual Machines
ManageIQ supports migrating virtual machines between datacenters, clusters, resource pools, folders and hosts. Create and submit a request with detailed environment information to which to migrate the VM.
To create a request to migrate a virtual machine:
-
Browse to menu: Compute > Infrastructure > Virtual Machines.
-
Click VMs & Templates on the accordion menu.
-
Select the VM to migrate.
-
Click Configuration, and then
 Lifecycle.
 -
Click
 Migrate selected items. The Migrate Virtual Machine form will appear.
 -
Under the Request tab:
-
Provide an E-mail address, First Name and Last Name.
-
Include any Notes and a Manager’s Name.
-
-
Under the Environment tab:
-
Select a Datacenter to migrate the VM to.
-
Select a Cluster from the list.
-
Choose a Resource Pool.
-
Select a Folder to migrate the VM to.
-
Under Host choose a Filter and click on a Name from the list that appears.
-
Filter the Datastore and click a Name from the results.
-
-
Under the Schedule tab:
- Select Schedule Info for migrating the virtual machine. Provide a Provision on date if selecting Schedule.
-
Click Submit.
Resource Pools
Resource pools are used to allocate CPU and memory across a group of virtual machines.
Removing a Resource Pool
If a resource pool is decommissioned or requires troubleshooting, it might require removal from the VMDB.
-
Browse to menu: Compute > Infrastructure > Resource Pools.
-
Click on the resource pool to remove.
-
Click Configuration, and then
 (Remove from the VMDB).
 -
Click OK.
The resource pool is removed. The virtual machines remain in the VMDB, but are no longer associated with this resource pool.
Tagging a Resource Pool
Use tags to categorize a resource pool.
-
Browse to menu: Compute > Infrastructure > Resource Pools.
-
Click the resource pool to tag.
-
Click
 (Policy), and then
 (Edit Tags).
 -
Select a customer tag from the first dropdown, and then a value for the tag.

Viewing the Resource Pool Summary
Use the Resource Pool Summary to see the number of discovered virtual machines, the parent host, and the parent cluster. It is the default view when you click on one resource pool.
Resource Pools Accordion
Use the Resource Pools accordion to access the properties and objects associated with the resource pool.
-
Click Properties to view the Resource Pools summary screen.
-
Click Relationships to see the clusters, virtual machines, and hosts related to this resource pool.
Datastores
A storage location is considered a device where digital information resides and is connected to a resource. ManageIQ detects, analyzes, and collects capacity and utilization data for both VMFS and NFS datastores. Datastores connected to a provider are automatically created on discovery. On creation of a repository, a datastore is automatically created.
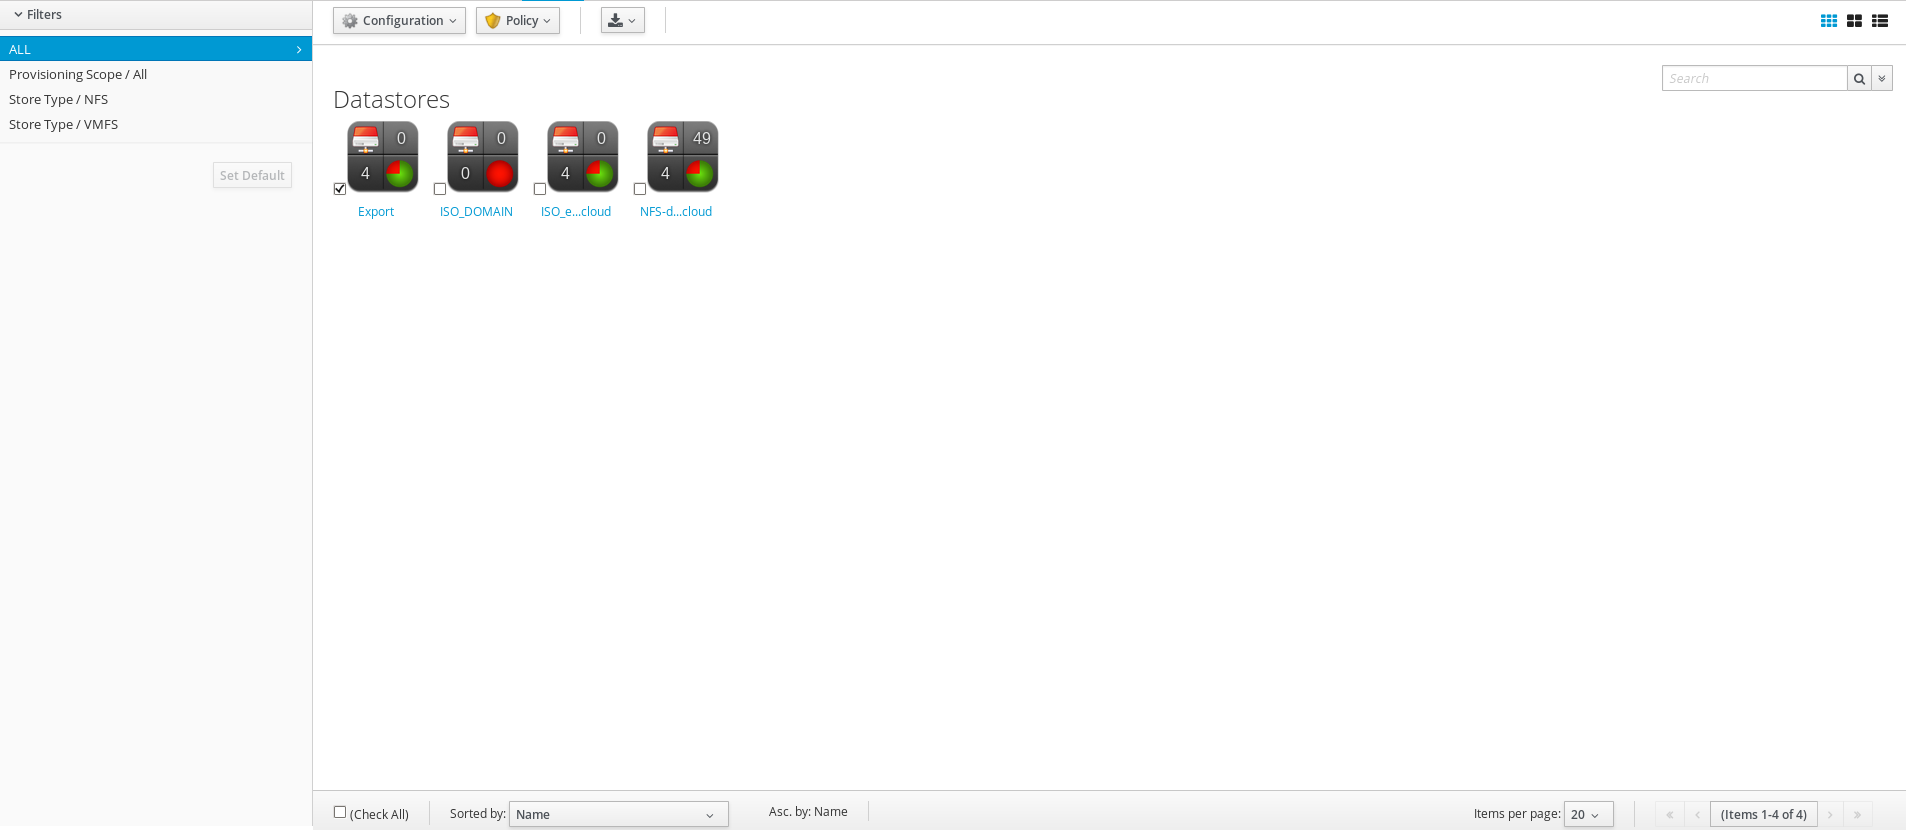
After detecting datastores, you might want to examine them more closely to see virtual machines, hosts, and available space.

-
File system type
-
Number of hosts
-
Number of virtual machines
-
Available space
Performing SmartState Analysis on Datastores
Analyze a datastore to collect information on the types of files on a datastore, and to see the number of managed/registered, managed/unregistered, and unmanaged virtual machines. To perform a SmartState analysis, the datastore is accessible from a running host and valid security credentials are supplied for that host.
Note:
-
SmartState analysis on datastores is processed by the Provider Operations role. It is enabled by default.
-
Be aware that executing a SmartState analysis on a datastore from the console takes a while to return data on the content. If capacity and utilization roles are enabled, ManageIQ performs the analysis automatically on a scheduled basis approximately every 24 hours.
-
Browse to menu: Compute > Infrastructure > Datastores.
-
Select the datastores to analyze.
-
Click Configuration, and then
 (Perform SmartState Analysis).
 -
Click OK.
Viewing a Datastore
You can click on a specific datastore to view its details. The screen provides you with a datastore taskbar, virtual thumbnail, accordion, and summary.
Datastore Management Screen.
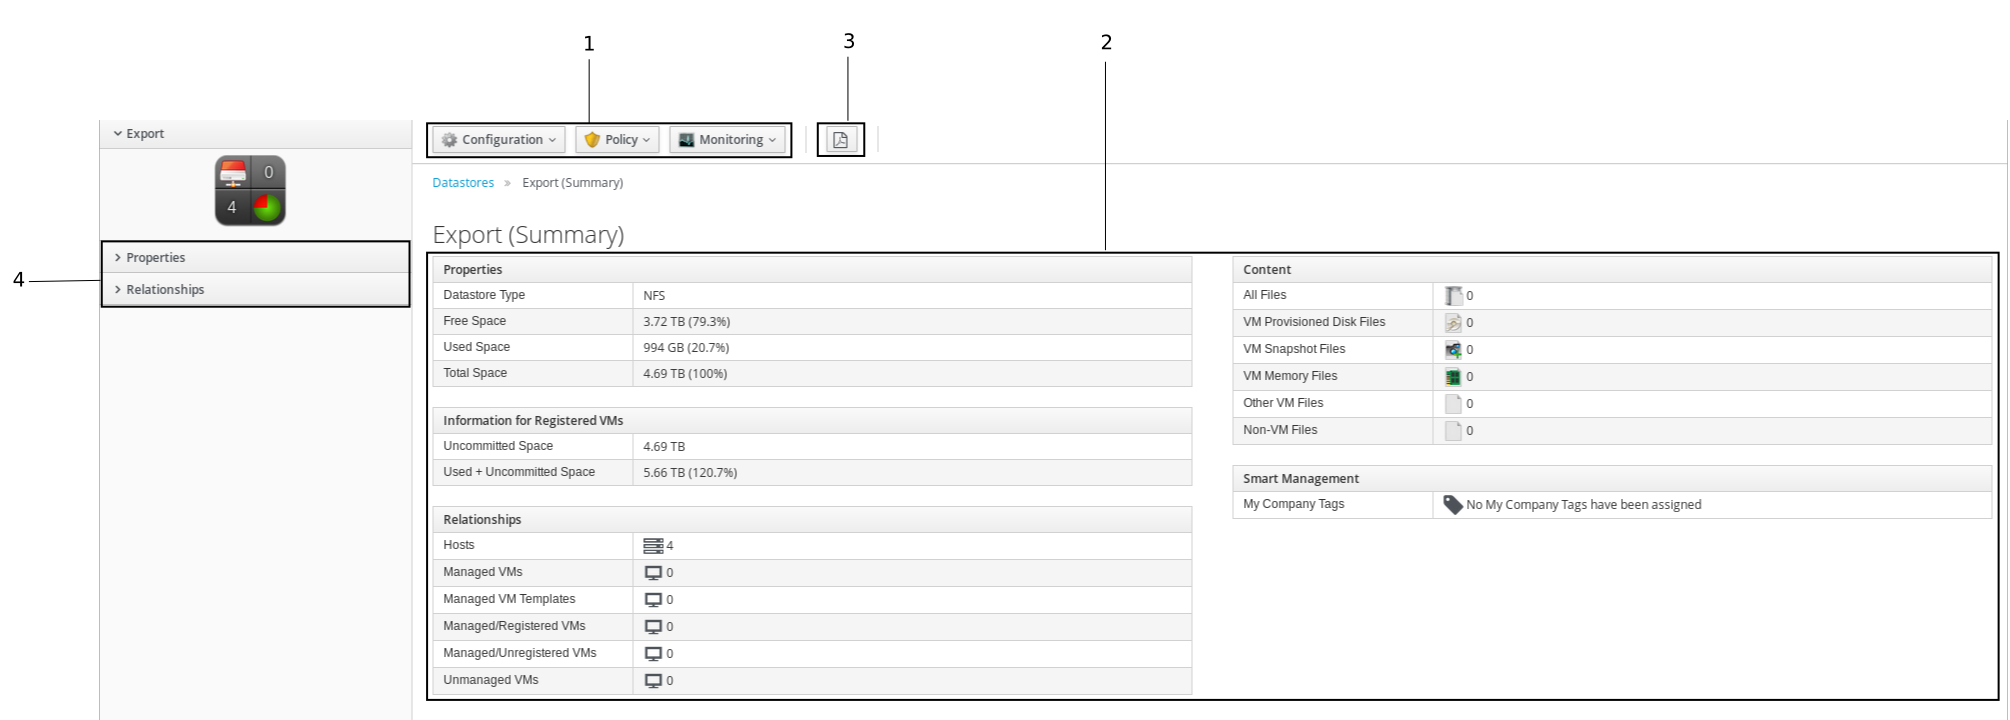
-
Datastore Taskbar: Choose between Configuration, Policy and Monitoring options for the selected datastore.
-
Datastore Summary: See summary such as datastore properties, storage, VM information.
-
Datastore PDF: Generates datastore summary in PDF format.
-
Datastore Accordion: See details about Properties, Relationships, Storage Relationships and Content for the chosen datastore.
Note:
To view Content section details, run a SmartState Analysis on the datastore. For information on how to perform SmartState Analysis, see Performing SmartState Analysis on Datastores.
Tagging a Datastore
Use tags to categorize a datastore.
-
Browse to menu: Compute > Infrastructure > Datastores.
-
Click the datastore to tag.
-
Click
 (Policy), and then
  (Edit Tags).
 -
Select a customer tag from the first list, and then a value for the tag from the second list.

-
Select more tags as required.
-
Click Save.
Viewing Capacity and Utilization Charts for a Datastore
You can view capacity and utilization data for a datastore.
Note:
ManageIQ requires network visibility to your provider assigned the server role of Capacity & Utilization Collector to enable this feature.
-
Browse to menu: Compute > Infrastructure > Datastores, then click the Datastore for which to view Capacity and Utilization data.
-
Click
 (Monitoring), and then
 (Utilization).
 -
From Interval, select to view hourly or daily data points and the dates to view data.
-
Use Show VM Types to include only managed/registered, managed/unregistered, or unmanaged virtual machines.
-
Managed/Registered VM - A virtual machine connected to a host and exists in the VMDB. Also, a template connected to a management system and exists in the VMDB.
Note:
Templates cannot be connected to a host.
-
Managed/Unregistered VM - A virtual machine or template that resides on a repository that is no longer connected to a management system or host, but exists in the VMDB. A virtual machine previously considered registered might become unregistered if the virtual machine is removed from management system inventory.
-
Not Managed - Files discovered on a datastore that do not have a virtual machine associated with them in the VMDB. These files might be registered to a management system that ManageIQ does not have configuration information. Possible causes might be the management system has not been discovered or the management system has been discovered but no security credentials are provided.
-
-
Use Time Profiles to select a time range for the data.
Note:
Daily charts only include full days of data. If a day does not include all the 24 data points for a day, the data does not show for that day.
For information about data optimization including utilization trend reports, see Data Optimization.
Removing a Datastore
If a datastore no longer contains any files associated with the virtual environment, remove it from the VMDB. This button is enabled only if a datastore is completely empty.
-
Browse to menu: Compute > Infrastructure > Datastores.
-
Click on the Datastore to remove.
-
Click Configuration, and then
 (Remove Datastore from
Inventory).
 -
Click OK.
Data Optimization
ManageIQ optimization functions allow you to view utilization trends in your environment. In addition, you can predict where you have capacity for more virtual machines, see Planning Where to Put a New Virtual Machine in the Deployment Planning Guide.
Note: To access the utilization report features, you will first need to enable data collection in ManageIQ; see the following sections in the Deployment Planning Guide:
Utilization Trends
ManageIQ allows you to view the resource utilization of your clusters, providers, and datastores. You can choose from summary, details, or report view.
Viewing a Utilization Trend Summary
This procedure shows you how to view a utilization trend summary.
-
Browse to menu: Overview > Utilization.
-
Click Summary if it is not already selected.
-
Expand the tree on the left side until you can see the wanted providers, clusters, or datastores.
-
Click the item.
-
Use the Options section in the Summary tab to change the characteristics of the data.
-
Use Trends to select how far back you want to calculate the trend.
-
Use Selected Day for the date you want to see percent utilization for in the chart on the Summary tab.
-
Use Classification to see trends only for a specific applied tag.
-
Use Time Profile to select an existing time profile. If the logged on user does not have any time profiles available, this option will not show.
-
Select a Time Zone.
-
Viewing Detail Lines of a Utilization Trend
This procedure shows you how to view detail lines of a utilization trend.
-
Browse to menu: Overview > Utilization.
-
Expand the tree on the left side until you can see the wanted providers, clusters, or datastores.
-
Click the item.
-
Click Details if it is not already selected.
-
From the Options area, select how far back you want to view the trends for and any classifications you want to use.
Viewing a Report of a Utilization Trend
To find out more about resource utilization, view utilization trend reports.
-
Browse to menu: Overview < Utilization.
-
Expand the tree on the left side until you can see the wanted providers, clusters, or datastores.
-
Click the item.
-
Click Report if it is not already selected.
-
From the Options area, select how far back you want to view the trends for and any classifications you want to use.
PXE Servers
PXE servers are used by ManageIQ to bootstrap virtual machines for the purpose of provisioning. They include images for different operating systems that can be customized using customization templates and are used in conjunction with IPMI Servers.
Availability Zones
An availability zone is a provider-specific method of grouping cloud instances and services. ManageIQ uses Amazon EC2 regions and OpenStack Nova zones as availability zones.
Viewing an Availability Zone
You can click on an availability zone to view its details. The screen provides you with an availability zone accordion and an availability zone summary page.
-
You can choose between graphical or text view of the datastore summary.
-
Use the availability zone accordion to view the Properties of the zone and its Relationships to other cloud resources.
-
Use the availability zone summary to see details on Relationships (Cloud Provider, Instances) and Smart Management (Company Tags).
Viewing Availability Zone Relationships
Use the availability zone accordion’s Relationship section to see items related to an availability zone.
-
Browse to menu: Compute > Clouds > Availability Zones.
-
Click the availability zone to view the configuration.
-
From the availability zone accordion, click Relationships.
-
Click the type of resource relationship to view as a list.
Cloud Tenants
A tenant is an OpenStack term for an organizational unit or project. ManageIQ creates cloud tenants to match existing OpenStack tenants for managing resources and controlling visibility of objects.
Note:
OpenStack tenant mapping must be enabled for cloud tenants to be created. See Tenant Mapping for details.
OpenStack uses tenants for the following reasons:
-
Assigning users to a project
-
Defining quotas for a project
-
Applying access and security rules for a project
-
Managing resources and instances for a project
This helps administrators and users organize their OpenStack environment and define limits for different groups of people. For example, one project might require higher quotas and another project might require restricted access to certain ports. OpenStack allows you to define these limits and apply them to a project.
ManageIQ can abstract information from tenants including quotas and relationships to other OpenStack objects.
To see multiple tenants in ManageIQ, the user authenticating to your OpenStack environment from ManageIQ must be configured to have visibility into these tenants.
Note:
This section describes OpenStack cloud tenant usage. For information about tenants created in ManageIQ for access and resource control, see Access Control in General Configuration.
Tenant Mapping
When adding an OpenStack cloud or infrastructure provider, enable tenant mapping in ManageIQ to map any existing tenants from that provider.
This means ManageIQ will create new cloud tenants to match each existing OpenStack tenant; each new cloud tenant and its corresponding OpenStack tenant will have identical resource assignments (including user and role synchronization) with the exception of quotas. Tenant quotas are not synchronized between ManageIQ and OpenStack, and are available for reporting purposes only. You can manage quotas in ManageIQ but this will not affect the quotas created in OpenStack.
During a provider refresh, ManageIQ will also check for any changes to the tenant list in OpenStack. ManageIQ will create new cloud tenants to match any new tenants, and delete any cloud tenants whose corresponding OpenStack tenants no longer exist. ManageIQ will also replicate any changes to OpenStack tenants to their corresponding cloud tenants.
If you leave tenant mapping disabled, ManageIQ will not create cloud tenants or tenant object hierarchy from OpenStack.
Viewing Cloud Tenant Relationships
From Compute > Clouds > Tenants, click on a specific cloud tenant to view its details.
The screen provides you with a cloud tenant accordion and a cloud tenant summary.
-
Use cloud tenant summary views to change how you are looking at the Summary.
-
Use the cloud tenant accordion to view the Properties of the tenant and its Relationships.
-
Use the cloud tenant summary to see details on Relationships (Cloud Provider, Security Groups, Instances, and Images), Quotas (including all OpenStack Compute, Network, and Volume quotas) and Smart Management (Company Tags).
Volumes
A volume is a block storage device that you can attach to or detach from an instance to manage the storage available to that instance. Volumes are managed through storage managers, which are added automatically to ManageIQ when the corresponding provider is added.
Amazon Elastic Block Store Manager Volumes
This section outlines the actions that you can perform on Amazon Elastic Block Store manager volumes.
Creating Volumes
You can create and attach volumes to your storage manager.
To create a volume:
-
Browse to menu: Storage > Block Storage > Volumes.
-
Click Configuration, then click
 (Add a new Cloud Volume).
 -
Select the Amazon Elastic Block Store manager from the Storage Manager list.
-
Select an availability zone from the Availability Zone list.
-
Enter a Volume Name.
-
Select the type of the volume from the Cloud Volume Type list.
Note:
See Amazon EBS Volume Types for more information on volume types.
-
Enter the size of the volume in gigabytes (GB).
-
Select whether the volume should be encrypted using the Encryption toggle.
-
Click Add.
The volume appears in the list of volumes after it has been provisioned.
Creating a Snapshot of a Volume
You can create a snapshot of a volume to preserve the state of the volume at a specific point in time. The snapshot can be used to create a duplicate of the volume.
To create a snapshot of a volume:
-
Browse to menu: Storage > Block Storage > Volumes.
-
Click the volume to snapshot to open the volume’s summary page.
-
Click Configuration, then click
 Create a Snapshot of this Cloud Volume.
 -
Enter a name for the snapshot in Snapshot Name.
-
Click Save.
Click Cloud Volume Snapshots on the summary page of a volume to view the snapshots for that volume.
Attaching a Volume to an Instance
To attach a volume to an instance:
-
Browse to menu: Storage > Block Storage > Volumes.
-
Select the volume to attach.
-
Click Configuration, then click
 Attach selected Cloud Volume to an Instance to open the Attach Cloud Volume screen.
 -
Select an instance from the list.
-
Optionally, enter a Device Mountpoint.
-
Click Attach.
Detaching a Volume from an Instance
To detach a volume from an instance:
-
Browse to menu: Storage > Block Storage > Volumes.
-
Select the volume to detach.
-
Click Configuration, then click
 Detach selected Cloud Volume from an Instance to open the Detach Cloud Volume screen.
 -
Select an instance from the list.
-
Click Detach.
Editing a Volume
You can edit several properties of existing volumes.
To edit a volume:
-
Browse to menu: Storage > Block Storage > Volumes.
-
Select the volume to edit to open its summary page.
-
Click Configuration, then click
 (Edit
this Cloud Volume).
 -
Enter a new Volume Name.
-
Select a new volume type from the Cloud Volume Type list.
Note:
See Amazon EBS Volume Types for more information on each of the volume types.
-
Enter a new size in gigabytes.
-
Click Save.
Deleting a Volume
To delete a volume from a storage manager:
-
Browse to menu: Storage > Block Storage > Volumes.
-
Select the volume to delete.
-
Click Configuration, then click
 (Delete selected Cloud Volumes).
OpenStack Block Storage Manager Volumes
This section outlines the actions that you can perform on OpenStack Block Storage manager volumes.
Creating Volumes
You can create and attach volumes to your storage manager.
To create a volume:
-
Browse to menu: Storage > Block Storage > Volumes.
-
Click Configuration, then click
 (Add a new Cloud Volume).
 -
Select the OpenStack Block Storage manager from the Storage Manager list.
-
Enter a Volume Name.
-
Enter the size of the volume in gigabytes (GB).
-
Under Placement, select the cloud tenant to attach it to.
-
Click Add.
The volume appears in the list of volumes after it has been provisioned.
Creating a Backup of a Volume
You can create a backup of a volume to protect against data loss, and restore it in the future.
To create a backup of a volume:
-
Browse to menu: Storage < Block Storage < Volumes.
-
Click the volume you want to back up to open the volume’s summary page.
-
Click Configuration, then click
 (Create a Backup of this Cloud
Volume).
 -
Enter a name for the backup in Backup Name.
-
(Optional) Select Incremental? to take an incremental backup of the volume instead of a full backup.
Note:
You can take an incremental backup of a volume if you have at least one existing full backup of the volume. An incremental volume saves resources by capturing only changes made to the volume since its last backup. See Create an Incremental Volume Backup in the Storage Guide for more information.
-
(Optional) Select Force? to allow backup of a volume attached to an instance.
Note:
Selecting the Force option will back up the volume whether its status is available or in-use. Backing up an in-use volume ensures data is crash-consistent.
-
Click Save.
View a volume’s backups by clicking Cloud Volume Backups on the volume’s summary page.
Note:
See Back Up and Restore a Volume in the Storage Guide for more information about backups.
Restoring a Volume from a Backup
In case of data loss, you can restore a volume from a backup with the following steps:
-
Browse to menu: Storage > Block Storage > Volumes.
-
Click the volume whose backup you want to restore. This will open the volume’s summary page.
-
Click Configuration, then click
 (Restore from a Backup of this
Cloud Volume).
 -
Select the volume to restore from in the Cloud Volume Backup list.
-
Click Save.
Restoring a Cloud Volume from a Backup
In case of data loss, you can restore from a cloud volume backup with the following steps:
-
Browse to menu: Storage > Block Storage > Volume Backups.
-
Select a Cloud Volume Backup to restore.
-
Click Configuration, then click
 (Restore backup to Cloud Volume).
 -
Select the Volume to restore from the backup.
-
Click Save.
Deleting a Cloud Volume Backup
Delete unnecessary cloud volume backups through the following steps:
-
Browse to menu: Storage > Block Storage > Volume Backups.
-
Select the Cloud Volume Backups to delete.
-
Click Configuration, then click
 (Delete
selected Backups).
 -
Click OK to confirm your choice.
Creating a Snapshot of a Volume
You can create a snapshot of a volume to preserve the state of the volume at a specific point in time. The snapshot can be used to create a duplicate of the volume.
To create a snapshot of a volume:
-
Browse to menu: Storage > Block Storage > Volumes.
-
Click the volume to snapshot to open the volume’s summary page.
-
Click Configuration, then click
 (Create a Snapshot of this Cloud
Volume).
 -
Enter a name for the snapshot in Snapshot Name.
-
Click Save.
Click Cloud Volume Snapshots on the summary page of a volume to view the snapshots for that volume.
Note:
See Create, Use, or Delete Volume Snapshots in the Storage Guide for more information about snapshots.
Attaching a Volume to an Instance
To attach a volume to an instance:
-
Browse to menu: Storage > Block Storage > Volumes.
-
Select the volume to attach.
-
Click Configuration, then click
 (Attach selected Cloud Volume
to an Instance) to open the Attach Cloud Volume screen.
 -
Select an instance from the list.
-
Optionally, enter a Device Mountpoint.
-
Click Attach.
Detaching a Volume from an Instance
To detach a volume from an instance:
-
Browse to menu: Storage > Block Storage > Volumes.
-
Select the volume to detach.
-
Click Configuration, then click
 Detach selected Cloud Volume from an Instance to open the Detach Cloud Volume screen.
 -
Select an instance from the list.
-
Click Detach.
Editing a Volume
Only the volume name can be edited on an existing volume.
To edit a volume’s name:
-
Browse to menu: Storage > Block Storage > Volumes.
-
Select the volume to edit to open its summary page.
-
Click Configuration, then click
 (Edit
this Cloud Volume).
 -
Enter the new Volume Name.
-
Click Save.
Deleting a Volume
To delete a volume from a storage manager:
-
Browse to menu: Storage > Block Storage > Volumes.
-
Select the volume to delete.
-
Click Configuration, then click
 (Delete selected Cloud Volumes).
IBM Power Systems Virtual Servers Block Storage Manager Volumes
This section outlines the actions that you can perform on IBM Power Systems Virtual Servers Block Storage manager volumes.
Creating Volumes
You can create and attach volumes to your storage manager.
To create a volume:
-
Browse to menu: Storage > Block Storage > Volumes.
-
Click Configuration, then click
 Add a new Cloud Volume.
 -
Select the desired IBM Power Systems Virtual Servers instance from the Storage Manager list.
-
Enter a Volume Name.
-
Select the type of the volume from the Cloud Volume Type list.
Note:
See Power Systems Virtual Servers documentation for more information on volume types.
-
Enter the size of the volume in gigabytes (GB).
-
Click Add.
The volume appears in the list of volumes after it has been provisioned.
Attaching a Volume to an Instance
To attach a volume to an instance:
-
Browse to menu: Storage > Block Storage > Volumes.
-
Select the volume to attach.
-
Click Configuration, then click
 (Attach selected Cloud Volume to an Instance) to open the Attach Cloud Volume screen.
 -
Select an instance from the list.
Note:
Note: A VM cannot have disks from different storage types. Only VMs matching storage type will be available for selection.
-
The Device Mountpoint field is not used.
-
Click Attach.
Detaching a Volume from an Instance
To detach a volume from an instance:
-
Browse to menu: Storage > Block Storage > Volumes.
-
Select the volume to detach.
-
Click Configuration, then click
 Detach selected Cloud Volume from an Instance to open the Detach Cloud Volume screen.
 -
Select an instance from the list.
-
Click Detach.
Deleting a Volume
To delete a volume from a storage manager:
-
Browse to menu: Storage > Block Storage > Volumes.
-
Select the volume to delete.
-
Click Configuration, then click
 (Delete selected Cloud Volumes).
Flavors
Flavors indicate the resource profiles available for instances. Each flavor contains a value set for CPUs, CPU cores and memory. Flavors allow you to pre-configure resource settings, which you can then apply during instance provisioning. You can also change the flavor of a provisioned instance; see Resizing an Instance for instructions.
ManageIQ provides the ability to view individual flavor information and instances currently using the flavor.
Creating a Flavor
You can create a new flavor for the provider.
-
Browse to menu: Compute > Clouds > Flavors.
-
Click Configuration, then click
 (Add a new Flavor).
 -
Select the provider from the Provider list.
-
Enter a Name for the flavor.
-
Enter RAM size in MB.
-
Enter VCPUs.
-
Enter Disk size in GB.
-
Enter Swap size in MB.
-
Enter RXTX factor. This is an optional property allows servers with a different bandwidth to be created with the RXTX factor. The default value is 1. That is, the new bandwidth will be the same as that of the attached network.
-
Click Public to set
TrueorFalse. The default isTrue. If you set it to false, select cloud tenants from the Cloud Tenant list. -
Click Add.
Viewing a Flavor
You can click on a specific flavor to view its details. The screen provides you with a flavor accordion and a flavor summary.
-
Use flavor summary views to change how you are looking at the summary.
-
Use the flavor accordion to view the Properties of the flavor and its Relationships.
-
Use the flavor summary to see details on Properties (CPUs, CPU Cores, Memory), Relationships (Cloud Provider, Instances), and Smart Management (Company Tags).
Viewing Flavor Relationships
Use the Relationship section in the flavor accordion to see items related to the flavor.
-
Browse to menu: Compute > Clouds > Flavors.
-
Click a flavor to view the configuration.
-
From the flavor accordion, click Relationships.
-
Click the type of resource to see the flavor’s relationships.
Deleting a Flavor
-
Browse to menu: Compute > Clouds > Flavors.
-
Select the flavors you want to remove from the list.
-
Click Configuration, then click
 Remove selected Flavors.
 -
Cick OK on the warning window to remove selected flavors permanently.
Cloud Networks
ManageIQ enables configuration and administration for the software-defined networking component of Red Hat OpenStack Platform. The virtual network infrastructure enables connectivity between instances and the physical external network.
This section describes common cloud network administration tasks, such as adding and removing subnets and routers to suit your Red Hat OpenStack Platform providers.
Creating and Administering Cloud Networks
Create a network to provide instances a place to communicate internally and receive IP addresses using Dynamic Host Configuration Protocol (DHCP). A network can also be integrated with external networks in your Red Hat OpenStack Platform deployment or elsewhere, such as the physical network.
Note:
-
Keystone API v3 is required to create cloud tenants on Red Hat OpenStack Platform cloud providers. For more information, see OpenStack Identity (keystone) in the Red Hat OpenStack Platform Architecture Guide.
-
For further details on cloud network objects and administration, see the Networking Guide in the Red Hat OpenStack Platform documentation..
Adding a Cloud Network
Add a new cloud network following the steps in this procedure:
-
Browse to menu: Network > Networks.
-
Click Configuration and then click Add a new Cloud Network.
-
In the Network Providers area, select a Network Manager from the drop-down menu.
-
Under Placement, select a Cloud Tenant.
-
In the Network Provider Information section, choose a Provider Network Type.
-
If Local is selected, provide a Physical Network name.
-
If GRE is selected, provide a Physical Network name and Segmentation ID.
-
-
In the Network Information area:
-
Provide a descriptive Network Name based on the role the network will perform.
-
Enable an External Router
-
Set the Administrative State to control whether the network is immediately available.
-
Establish Shared status of the network.
-
-
Click Add.
Editing Cloud Network Details
To edit network information details of a cloud network:
-
Browse to menu: Networks > Networks.
-
Select a network from the list view.
-
Click Configuration, then
 (Edit selected
Cloud Network).
 -
Edit Network Information fields.
-
Click Save.
Deleting a Cloud Network
To delete a cloud network:
-
Browse to menu: Networks > Networks.
-
Select a cloud network from the list view.
-
Click Configuration, then click Delete selected Cloud Networks.
Creating and Administering Subnets
ManageIQ enables creation and administration of subnets for your cloud networks. Create subnets in pre-existing networks as means to grant network connectivity to instances. Subnets are the means by which instances are granted network connectivity. Each instance is assigned to a subnet as part of the instance creation process.
Consider proper placement of instances to best accommodate their connectivity requirements:
-
Tenant networks in OpenStack Networking can host multiple subnets.
-
Subnets are isolated from one another.
-
Host distinctly different systems on different subnets within the same network.
-
Instances on one subnet that wish to communicate with another subnet must have traffic directed by a router.
-
Place systems requiring a high volume of traffic amongst themselves in the same subnet, avoiding routing and subsequent latency and load issues.
Adding a Subnet
Add a subnet to an existing cloud network following the procedure below.
-
Browse to menu: Networks > Subnets.
-
Click Configuration, then click Add a new Cloud Subnet.
-
Select a Network Manager.
-
Under Placement, select a Cloud Tenant.
-
Provide the following Cloud Subnet details:
-
A descriptive Subnet Name.
-
The Gateway IP address of the router interface for the default gateway.
-
Enable DHCP services for the subnet. DHCP allows automated distribution of IP settings to instances.
-
Select the IP Version. The IP address range in the Network Address field must match whichever version you select.
-
Input the Subnet CIDR address in CIDR format, which contains the IP address range and subnet mask in one value.
Note:
Determine the address by calculating the number of bits masked in the subnet mask and append that value to the IP address range. For example, the subnet mask 255.255.255.0 has 24 masked bits. To use this mask with the IPv4 address range 192.168.122.0, specify the address 192.168.122.0/24.
-
Editing a Cloud Subnet
To edit the details of a cloud subnet:
-
Browse to menu: Networks > Subnets.
-
Click on a subnet from the list view.
-
Click Configuration, then
 Edit this Cloud Subnet.
 -
Edit Cloud Subnet details fields.
-
Click Save.
Configuring Network Routers
ManageIQ enables configuration for Red Hat OpenStack Platform provider cloud network routing services using an SDN-based virtual router.
-
Routers are a requirement for your instances to communicate with external subnets, including those out in the physical network.
-
Routers and subnets connect using interfaces, with each subnet requiring its own interface to the router.
-
A router’s default gateway defines the next hop for any traffic received by the router.
-
A router’s network is typically configured to route traffic to the external physical network using a virtual bridge.
Adding a Network Router
Add a network router to an existing cloud network by following the procedure below.
-
Browse to menu: Networks > Network Routers.
-
Click Configuration and click Add a new Router.
-
In the Network Provider area, select a Network Manager.
-
Provide a Router Name.
-
Under External Gateway:
-
If Yes is selected, provide the following:
-
Choose to Enable Source NAT. In Source Network Address Translation (SNAT), he NAT router modifies the IP address of the sender in IP packets. SNAT is commonly used to enable hosts with private addresses to communicate with servers on the public Internet.
-
Select a Network.
-
Select a Subnet.
-
-
-
Select a Cloud Tenant.
-
Click Add.
Editing Network Router Details
To edit the details of a network router:
-
Browse to menu: Networks > Network Routers.
-
Select a network router from the list view.
-
Click Configuration, then
 Edit selected Router.
 -
Edit required fields.
-
Click Save.
Adding an Interface to a Network Router
Interfaces allow you to interconnect routers with subnets. As a result, the router can direct any traffic that instances send to destinations outside of their intermediate subnet.
To add an interface to a network router:
-
Browse to menu: Networks > Network Routers.
-
Select a network router from the list view.
-
Click Configuration, then
 (Add Interface
to this Router).
 -
Select a Subnet from the list.
-
Click Add.
Removing a Network Router Interface
You can remove an interface to a subnet if you no longer require the router to direct its traffic.
To remove an interface:
-
Browse to menu: Networks > Network Routers.
-
Select a network router in the list view.
-
Click Configuration, then
 (Remove
Interface from this Router).
 -
Confirm your choice.
Deleting a Network Router
To delete a network router:
-
Browse to menu: Networks > Network Routers.
-
Select a network router from the list view.
-
Click Configuration, then click Delete selected Routers.
Creating Floating IPs
Floating IP addresses allow you to direct ingress network traffic to your cloud network instances. Define a pool of validly routable external IP addresses, which can then be dynamically assigned to an instance. All incoming traffic destined for that floating IP is routed to the instance to which it has been assigned.
Note:
Red Hat OpenStack Networking allocates floating IP addresses to all projects (tenants) from the same IP ranges/CIDRs. As a result, every subnet of floating IPs is consumable by any and all projects. Manage this behavior using quotas for specific projects.
Adding Floating IPs.
Floating IP addresses allow you to direct ingress network traffic to your instances.
Add floating IP addresses to an existing cloud network by following the procedure below.
-
Browse to menu: Networks > Floating IPs.
-
Click Configuration and click Add a new Floating IP.
-
Select a Network Manager.
-
Choose an External Network
-
Under Association Information provide the following:
-
(Optional) An Associated Port for the floating IP.
-
(Optional) The Floating IP Address.
-
-
Select a Cloud Tenant.
-
Click Add.
Managing Port Association of a Floating IP
To manage the port associations of a floating IP:
-
Browse to menu: Networks > Floating IPs.
-
Click on a floating IP from the list view.
-
Click Configuration, then
 Manage the port association of this Floating IP.
 -
To associate a port, add a new Port id
-
To disassociate a port, delete the Port id field information.
-
Click Save.
Deleting a Floating IP
To delete a floating IP
-
Browse to menu: Networks > Floating IPs.
-
SClick on a floating IP from the list view to view its summary page.
-
Click Configuration, then click Delete this Floating IP.
Security Groups
You can group instances using security groups to restrict port or IP address accessibility. Security groups can be created and assigned to instances using ManageIQ instance provisioning.
Cloud providers that currently support this function include: Amazon EC2, OpenStack, and Red Hat Enterprise Virtualization.
Editing Security Group Details
Editing security group information allows users to make changes to existing security group details and firewall rules, in additional to adding new firewall rules.
To edit details of a security group:
-
Browse to menu: Networks > Security Groups.
-
Click on a security group to view the summary page.
-
Click Configuration, then
 Edit this Security Group.
 -
Under Security Group Information, edit the Security Group Name and the Security Group Description.
-
Edit existing Firewall Rules or add new firewall rules by clicking Add a Firewall Rule.
-
Click Save.
Viewing Security Groups
This procedure describes how to view security groups.
-
Browse to menu: Networks > Security Groups.
-
Click the desired security groups for viewing the details.
-
In Properties, you can view the basic information of the security group.
-
In Relationships, you can view the cloud provider and the instances associated with the security group.
-
In Firewall Rules, you can view a list of ports and IP ranges that are accessible.
Note:
This box is not available if you have not set any rules for your security group.
-
Tagging Security Groups
Apply tags to security groups to categorize them.
-
Browse to menu: Networks > Security Groups.
-
Select the security group to tag.
-
Click
 (Policy), and then
 (Edit Tags).
 -
Select a customer tag to assign from the dropdown menu.
-
Select a value to assign.
-
Click Save.
Deleting a Security Group
To delete a security group:
-
Browse to menu: Networks > Security Groups.
-
Click on a security group in the list view to view its summary page.
-
Click on Configuration, then click Delete this Security Group.
Instances and Images
Images are the static templates containing the software configuration from which you provision a running Instance - a virtual machine, with which you can interact - on your cloud provider.
The Instance and Images containers, combined with the ability to analyze information inside each instance or image, provides in-depth information across the cloud environment. This rich set of information enables ManageIQ users to improve problem resolution times and effectively manage instances and images in their cloud environment.
The Instances and Images pages display all instances and images the server discovered from your cloud providers. The taskbar on each page is a menu driven set of buttons that provide access to functions related to instances and images.
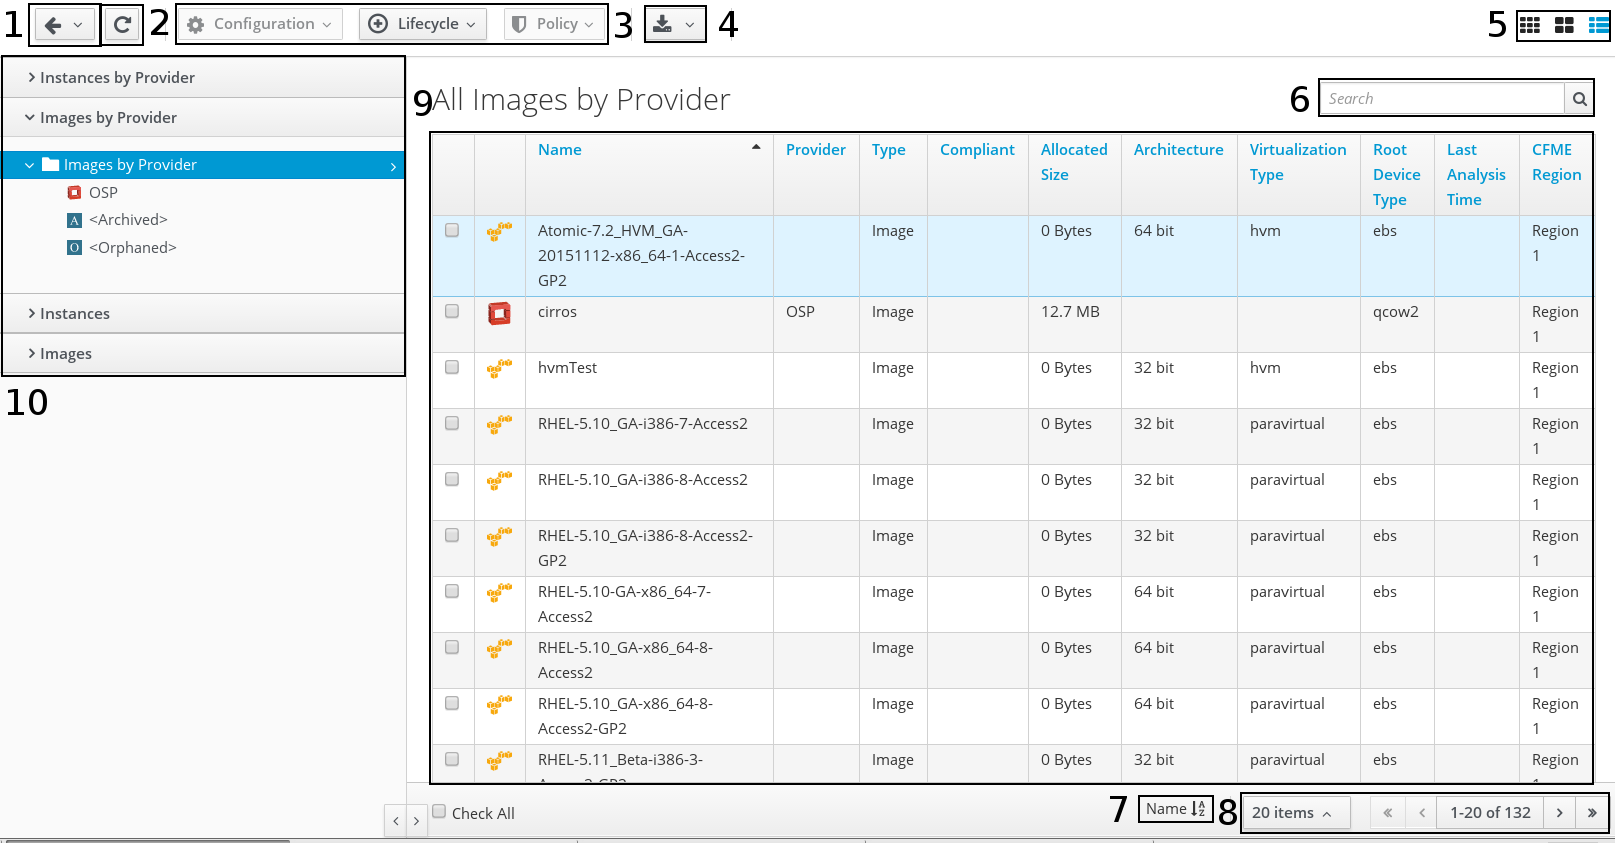
-
History button
-
Refresh screen button
-
Taskbar
-
Download buttons
-
View buttons
-
Name search bar/Advanced Search button
-
Sort dropdown
-
Navigation bar
-
Main area in List View
-
Cloud/Filter Navigation
Console uses Virtual Thumbnails to describe instances and images. Each thumbnail contains four quadrants by default. This allows you to glance at an instance or image for a quick view of its contents.

-
Top left quadrant: Operating system of the Instance
-
Bottom left quadrant: Instance Cloud Provider
-
Top right quadrant: Power state of Instance or Status icon
-
Bottom right quadrant: Number of Snapshots for this Instance
| Icon | Description |
|---|---|
 |
Template: Cloud Image |
 |
Retired: Instance has been retired |
 |
Archived: Instance has no provider or availability zone associated with it. |
 |
Orphaned: Instance has no availability zone but does have a provider associated with it. |
 |
Disconnected: Instance is disconnected. |
 |
On: Instance is powered on. |
 |
Off: Instance is powered off. |
 |
Suspended: Instance has been suspended. |
The Instances page has four accordions organizing your instances and images in different ways. All of these accordions share a set of common controls:
-
Use Instances by Provider and Images by Provider to view your instances and images organized by provider. In addition, you can see archived and orphaned items here.
-
Use the Instances to view, apply filters, and collect information about all of your instances.
-
Use Images to view, apply filters, and collect information about all of your images.
Through the console, you can view your instances and images in multiple ways:
-
Filter instances
-
Change views
-
Sort
-
Create a report
-
Search by Tags
-
Search by collected data
Filtering Instances and Images
The Instance Filter accordion is provided so that you can easily navigate through groups of instances. You can use the ones provided or create your own through Advanced Filtering capabilities.
Using an Instance or Image Filter
-
Browse to menu: Compute > Clouds > Instances.
-
Click on the Instances or Images accordion.
-
Click on the desired filter from the left pane.
Creating an Instance or Image Filter
-
Browse to menu: Compute > Clouds > Instances.
-
Go to the Instances or Images accordion.
-
Click All Instances or All Images, then click
 (Advanced Search) to open the
expression editor.
 -
Use the expression editor to choose the appropriate options for your criteria. Based on what you choose, different options will show.
-
For all of the types of searches, you have the options of creating an alias and requested user input. Select Use Alias to create a user friendly name for the search. If you are requested user input for the search, this text will show in the dialog box where the input is requested.
-
Click Field to create criteria based on field values.

-
Click Count of to create criteria based on the count of something, such as the number of snapshots for an instance, or the number of instances on a host.

-
Click Tag to create criteria based on tags assigned to your virtual infrastructure, such as for power states or production tagging.

-
Click Find to seek a particular value, and then check a property.

-
-
Click
 (Commit Expression Element
Changes) to add the expression.
 -
Click Save.
-
Type in a name for the search expression in Save this Instance search as. To set the filter to show globally, check Global Search.
-
Click Save.
The filter is saved and shows in the My Filters area of the Filter accordion. If you checked Global Search, the filter shows there.
Loading a Report Filter or Search Expression
-
Browse to menu: Compute > Clouds > Instances.
-
Click the accordion for the items to search (either Instances or Images).
-
Click
 (Advanced Search) to open the
expression editor.
 -
Click Load.
-
Select either a saved instance search or an instance report filter.
Note:
The set of items to select will depend on the type of resource you are searching.
-
Click Load to load the search expression.
-
If you want to edit the expression, click on it and make any edits for the current expression.
-
Click
 (Commit expression element
changes) to add the changes.
 -
Click
 (Undo the previous change)
to remove the change you just made.
 -
Click
 (Redo the previous change)
to put the change that you just made back.
 -
Click
 (AND with a new expression
element) to create a logical
 ANDwith a new expression element. -
Click
 (OR with a new expression
element) to create a logical
 ORwith a new expression element. -
Click
 (Wrap this expression element
with a NOT) to create a logical NOT on an expression element
or to exclude all the items that match the expression.
 -
Click
 (Remove this expression
element) to take out the current expression element.
-
-
Click Load.
-
Click Apply.
Changing Views for Instances and Images
While you can set the default view for different pages from the settings menu, then menu: Configuration > My Settings > Default Views, the current view can also be controlled from the Instances pages.
-
Browse to menu: Compute > Clouds > Instances.
-
Click the accordion for the items to view.
-
Click the appropriate button for the desired view.
-
Click
 for Grid View.
 -
Click
 for Tile View.
 -
Click
 for List View.
-
Sorting Instances and Images
Virtual machines and images can be sorted by Name, Availability Zone, Flavor, Cloud Provider, Compliant, Last Analysis Time, and Region.
-
Browse to menu: Compute > Clouds > Instances.
-
Click the accordion for the desired items to sort.
-
To sort instances or images when in grid or tile view:
- From the Sort by dropdown, click the attribute to sort.
-
To sort instances or images when in list view:
-
Select the List View.
-
Click on the Column Name to sort. For example, click on Availability Zone to sort by the name of the availability zone.
-
Creating an Instance or Image Report
For a listing of instances and images, you can create a quick report in CSV, TXT, or PDF formats.
-
Browse to menu: Compute > Clouds > Instances.
-
Click the accordion for the desired items for report creation.
-
Click
 (Download).
-
Click
 for a TXT file.
 -
Click
 for a CSV file.
 -
Click
 for a PDF file.
-
Searching for Instances or Images
To the right of the taskbar on the Instances page, you can enter names or parts of names for searching. You can search in the following ways.
-
Type characters that are included in the name. For example, if you type
sp1, all Instances whose names includesp1appear, such asWindows2003andSp1clone. -
Use
*at the end of a term to search for names that begin with specific characters. For example, typev*to find all instances whose names begin with the letterv. -
Use
*at the beginning of a term to search for names that end with specific characters. For example, type*\sp2to find all instances whose names end withsp2. -
Erase all characters from the search box to go back to viewing all instances.
Search for instances and images:
-
Browse to menu: Compute > Clouds > Instances.
-
Click the accordion for the desired items to search.

-
In the Name Filter bar in the upper right corner of the window, type your criteria.
-
Click
 (Search by Name within results)
or press Enter.
 -
Type in other criteria to filter on what is currently displayed.
-
Click
 (Search by Name within results)
or press Enter.
Analyzing Instances and Images with SmartState Analysis
Analyze an instance to collect metadata such as user accounts, applications, software patches, and other internal information. If ManageIQ is not set up for automatic analysis, perform a manual analysis of an instance. To perform a SmartState Analysis, ManageIQ requires a running SmartProxy with visibility to the instance’s storage location so that a snapshot can be created.
-
Browse to menu: Compute > Clouds > Instances.
-
Click the accordion for the items to analyze.
-
Check the instances and images to analyze.
-
Click Configuration, and then
 Perform SmartState Analysis on the taskbar.
 -
Click OK.
Note:
Restrictions on Displaying Files Collected
-
File size bigger than 20k characters
-
File with missing name
-
Non MIME .conf file, with non ascii characters
-
Non MIME .conf file, without content
-
MIME .exe binary file
-
MIME .txt non binary file
-
Non MIME .conf ascii file
Comparing Instances and Images
You can compare multiple instances in ManageIQ server. This allows you to see how different instances are from their original image. This helps detect missing patches, unmanaged user accounts, or unauthorized services.
Use the comparison feature to:
-
Compare multiple instances from different hosts
-
Compare multiple instances side-by-side
-
Quickly see similarities and differences among multiple instances and a base
-
Narrow the comparison display to categories of properties
-
Print or export in the comparison results to a PDF or CSV file
Compare instances and images:
-
Browse to menu: Compute > Clouds > Instances.
-
Click the accordion for the items to analyze.
-
Click the checkboxes for the items to compare.
-
Click Configuration, and then
 (Compare Selected items). The
comparison displays in a compressed view with a limited set of
properties listed.
 -
To delete an item from the comparison, click
 (Remove this VM from the comparison) at
the bottom of the items column.
 -
To view many items on one screen, go to a compressed view by clicking
 (Compressed View). To return
to an expanded view, click
  (Expanded
View).
 -
To limit the mode of the view, there are two buttons in the task bar.
-
Click
 (Details Mode) to see all
details for an attribute.
 -
Click
 (Exists Mode) to limit the
view to if an attribute exists compared to the base or not. This
only applies to attributes that can have a boolean property. For
example, a user account exists or does not exist, or a piece of
hardware that does or does not exist.
-
-
To change the base instance that all the others are compared to, click its label at the top of its column.
-
To go to the summary screen for an instance, click its Virtual Thumbnail or icon.
Creating an Instance Comparison Report
Output a the data from a comparison report in TXT, CSV or PDF formats.
-
Create the comparison for the report.
-
Click
 (Download).
-
Click
 for a TXT file.
 -
Click
 for a CSV file.
 -
Click
 for a PDF file.
-
Refreshing Instances and Images
Refresh your instances to get the latest data the provider can access. This includes information such as the power state, container, and hardware devices attached to the instance.
-
Browse to menu: Compute > Clouds > Instances.
-
Click the accordion for the desired items to analyze.
-
Click the checkboxes for the items to refresh.
-
Click Configuration, and then
 (Refresh Relationships and Power
States) on the Instance Taskbar.
Extracting Running Processes from Instances and Images
ManageIQ can collect processes running on Windows instances. To do this, enter domain credentials for the zone where the instance is located. The instance must be running and must have an IP address in the VMDB, usually obtained from a SmartState Analysis.
-
Browse to menu: Compute > Clouds > Instances.
-
Click the checkboxes for the instances to collect processes.
-
Click Configuration, and then
 (Extract Running Processes) on the
taskbar.
 -
Click OK.
Setting Ownership for Instances and Images
You can set the owner of a group of instances and images by either individual user or group. This allows you an additional way to filter and can be used to enforce quotas.
-
Browse to menu: Compute > Clouds > Instances.
-
Click the accordion for the items to change.
-
Click the checkboxes for the items to set ownership.
-
Click Configuration, and then
 (Set Ownership) on the Instance
Taskbar.
 -
From the Select an Owner dropdown, select a user.

-
From the Select a Group dropdown, select a group
-
Click Save.
Removing Instances and Images from the VMDB
If an instance has been decommissioned or you need to perform some troubleshooting, you might need to remove a specific instance from the VMDB. This does not however remove the instance or image from its provider.
-
Browse to menu: Compute > Clouds > Instances.
-
Click the accordion for the items to remove.
-
Click the checkboxes for the items to remove.
-
Click Configuration, and then
 (Remove from the VMDB) button.
 -
Click OK.
Tagging Instances and Images
-
Browse to menu: Compute > Clouds > Instances.
-
Click the accordion for the items to tag.
-
Click the checkboxes for the items to tag.
-
Click
 (Policy), and then
 (Edit Tags).
 -
Select a customer tag from the first dropdown, and then a value for the tag.

-
Click Save.
Reviewing an Instance or Image
After viewing your list of instances and images, click on a specific item to review a Summary screen of it. The Summary screen provides you with a Virtual Thumbnail and a Taskbar.
-
Use the Taskbar to perform actions on the selected item.
-
Use Summary Views to change the view type of the summary screen.
-
Use Virtual Thumbnails for a quick glance at the item.
-
Use the Summary screen to see a quick summary of the attributes of the item.
Viewing Running Processes after Collection
-
Click an instance with collected processes.
-
From the Diagnostics area, click Running Processes.
The most recent collection of running processes is displayed. Sort this list by clicking on the column headers.
Managing Security Groups for Cloud Instances
Manage security groups associated with cloud provider instances using ManageIQ.
To add a security group to an instance:
-
Browse to menu: Compute > Clouds > Instances.
-
Click on Instances by Provider, and select an instance.
-
Click Configuration, then click
 (Add a
Security Group).
 -
Select a Security Group from the drop-down menu to add to the instance.
-
Click Save.
To remove a security group from an instance:
-
Browse to menu: Compute > Clouds > Instances.
-
Click on Instances by Provider, and select an instance.
-
Click Configuration, then click
 (Remove a Security Group).
 -
Select a Security Group from the drop-down menu to remove from the instance.
-
Click Save.
Editing Instance or Image Properties
Edit the properties of an instance or image to set parent and child instances. SmartState Analysis also can detect this.
-
From Compute > Clouds > Instances.
-
Click the accordion for the items to edit.
-
Click the item to edit properties.
-
Click
 (Configuration), and then
 (Edit this Instance or Edit this Image)
on the Taskbar.
 -
From the Parent Instance dropdown, select the parent instance.
-
From Child Instance selection, select instances that are based on the current instance from the list of Available Instances.
-
Click Save.
Controlling the Power State of an Instance
Follow this procedure to control the power states of an instance through the ManageIQ console.
-
Navigate to Compute > Clouds > Instances.
-
Click the instance to change the power state.
-
Click Power Operations, then click the button for the desired power operation.
-
Click
 (Start) to start the
selected instances.
 -
Click
 (Terminate) to terminate the
selected instances.
 -
Click
 (Suspend) to suspend the
selected instances.
 -
Click
 (Reset) to reset the
selected instances.
 -
Click
 (Stop Guest) to stop the
guest operating system.
 -
Click
 (Restart Guest) to restart
the guest operating system.
-
-
Click OK.
Right Sizing an Instance
ManageIQ uses collected statistics to recommend the best size for an instance. ManageIQ uses the information from the Normal Operating Range to calculate the recommendations.
-
Browse to menu: Compute > Clouds > Instances.
-
Click an instance for right-sizing.
-
Click Configuration, and then
 (Right-Size Recommendations) button.
A new page appears with three levels of Memory and CPU recommendations, Conservative, Moderate, and Aggressive, next to the Normal Operating Range statistics.
Resizing an Instance
ManageIQ allows you to resize an existing, active instance by changing its flavor. This is only possible if your OpenStack deployment has:
-
At least two Compute nodes, or with resizing to the same host enabled
-
Enough capacity to support the needs of the new flavor
Note:
Keep in mind that the instance will undergo a controlled shutdown when you change its flavor.
For more information about the requirements and underlying OpenStack process involved, see Resize an Instance in the Red Hat OpenStack Platform Instances and Images Guide.
To resize an instance through ManageIQ:
-
Browse to menu: Compute > Clouds > Instances.
-
Click the instance whose flavor you want to change.
-
Click Configuration, and then
 (Reconfigure this Instance).
 -
In the Reconfigure Instance section, select the new flavor you want from the Choose Flavor dropdown.
-
Click Submit. Doing so will initiate the flavor change, and it might take several minutes before ManageIQ verifies whether the change was successful.
See Flavors and Manage Flavors in the Red Hat OpenStack Platform Instances and Images Guide for more information.
Migrating a Live Instance
Live migration involves moving a live instance between Compute nodes. Live migration is useful for avoiding instance downtime during cloud maintenance or load management. See How to Migrate a Live Instance in the Red Hat OpenStack Platform Migrating Instances guide for details on the underlying OpenStack process.
To migrate a live instance:
-
Browse to menu: Compute > Clouds > Instances.
-
On the right pane, click the instance to be migrated. Use the Instances by Provider accordion to filter instances by provider and/or availability zone.
-
Click
 (Lifecycle), then
 (Migrate selected Instance).
 -
On the Migrate Instance section, select your preferred migration options:
-
Auto-select Host?: let the OpenStack provider automatically choose a destination Compute node. If you prefer to choose a specific node, uncheck this option and choose from the Destination Host dropdown.
-
Block Migration: check this option to perform a block-based migration. With this migration, the entire virtual machine image is moved from the source node to the destination node. If your OpenStack provider uses shared storage, leave this option unchecked. See Prerequisites in the Red Hat OpenStack Platform Migrating Instances guide for related information.
-
Disk Over Commit: check this option to prevent the OpenStack provider from verifying first whether the destination host has available disk space to host the instance.
-
-
Click Submit.
Once the migration initiates, the instance list will reload with a
message indicating that the selected instance is being migrated. Upon
completion, the instance list will reload and the evacuated instance
will be displayed as  (On).
(On).
Evacuating an Instance
If a Compute node is shut down, you can evacuate instances hosted on it. This is only useful if the instances use shared storage or block storage volumes. See Evacuate Instances in the Red Hat OpenStack Platform Instances and Images Guide for details on the underlying OpenStack process.
To evacuate an instance:
-
Browse to menu: Compute > Clouds > Instances.
-
On the right pane, click the instance to be evacuated. Use the Instances by Provider accordion to filter instances by provider and/or availability zone.
-
Click
 (Lifecycle), then
 (Evacuate selected Instance).
 -
On the Evacuate Host section, select your preferred evacuation options:
-
Auto-select Host?: let the OpenStack provider automatically choose a destination Compute node. If you prefer to choose a specific node, uncheck this option and choose from the Destination Host dropdown.
-
On Shared Storage: leave this checked to indicate that all instance files are on shared storage.
-
-
Click Submit.
Once the evacuation initiates, the instance list will reload with a
message indicating that the selected instance is being evacuated. Upon
completion, the instance list will reload and the evacuated instance
will be displayed as  (On).
(On).
Viewing Capacity and Utilization Charts for an Instance
View capacity and utilization data for instances that are part of a cluster.
Note:
You must have a server with network visibility to your provider assigned the server role of Capacity & Utilization Collector to use this feature.
-
Browse to menu: Compute > Clouds > Instances.
-
Click the accordion to view capacity data.
-
Click the item to view.
-
Click
 (Monitoring), and then
  (Utilization) on the taskbar.
 -
Select to view hourly, most recent hour, or daily data points for the dates to view data.

-
Select a Time Profile.

Note:
Daily charts only include full days of data. This means ManageIQ does not show daily data for a day without a complete 24 data point range for a day.
For information about data optimization including utilization trend reports, see Data Optimization.
Viewing the Instance or Image Timeline
View the timeline of events for an instance or image if registered to a host.
-
Browse to menu: Compute > Clouds > Instances.
-
Click the instance to view the timeline.
-
Click
 (Monitoring), and then
 (Timelines) on the taskbar.
 -
From Options, customize the period of time to display, and the types of events to view.

-
Use the Interval dropdown to select hourly or daily data points.
-
Use Date to type the date of the timeline to display.
-
If viewing a daily timeline, use Show to set how many days back to go. The maximum history is 31 days.
-
The three Event Group dropdowns allow selection of different event groups to display. Each has its own color.
-
From the Level dropdown, select either a Summary event or a Detail list of events. For example, the detail level of a Power On event might include the power on request, the starting event, and the actual Power On event. If you select Summary, you only see the Power On event in the timeline.
-
-
To see more detail on an item in the timeline, click on it. A balloon appears with a clickable link to the resource.
Viewing the Instance or Image Summary
When you click on a specific instance or image, you will see the Virtual Thumbnail, and an operating system-specific summary screen of the item. Where applicable, click on a subcategory of the summary to see more detail on that section.
The summary page contains the following categories:
-
Properties include information such as the base operating system, hostname, IP addresses, instance vendor, cloud resources, and snapshots. This includes the ability to analyze multiple partitions, multiple disks, Linux logical volumes, extended partitions, and Windows drives. Some categories can be clicked on for additional detail. For example, click Container to view notes associated with an instance.
-
Lifecycle shows the date of discovery and the last analysis. If a retirement date and time or owner has been set, these display as well.
-
Relationships include information on the instance’s cloud provider, genealogy such as parent and child instances, and drift.
-
VMsafe shows properties of the VMsafe agent if it is enabled.
-
Compliance shows the status of system compliance checks and history of past checks.
-
Power Management displays the current power state, last boot time, and last power state change. State Changed On is the date that the instance last changed its power state. This is a container view of the power state, therefore a restart of the operating system does not cause the container power state to change and does not update this value.
-
Security includes information on users and groups.
-
Configuration includes information on applications, services, packages, init processes, and files. This section changes depending on the base operating system.
-
Diagnostics provides a link to viewing running processes and the information from the latest collected event logs.
-
Smart Management shows all tags assigned to this instance.
Performing a SmartState Analysis on an instance or image provides more detailed information in these categories.
Viewing User Information for an Instance or Image
ManageIQ’s SmartState Analysis feature returns user information. Explore the user to get details on the user’s account, including group memberships.
-
Browse to menu: Compute > Clouds > Instances.
-
Click on the instance or image to open its summary page.
-
From the Security section of the summary page, click Users.
-
Click the user to view details.
Viewing Group Information for an Instance or Image
ManageIQ’s SmartState Analysis feature returns group information. Explore the group to get a list of its users.
-
Browse to menu: Compute > Clouds > Instances.
-
Click the accordion for the item to view user information.
-
Click on the item to view its Summary.
-
From the Security section of the Instance Summary, click Groups.
-
Click the group to view users.
Viewing Genealogy of an Instance or Image
ManageIQ detects the lineage of an instance. View an instance’s lineage and compare the instances that are part of its tree. This also allows tagging of instances that share genealogy.
-
Browse to menu: Compute > Clouds > Instances.
-
Click the accordion for the item to view genealogy.
-
Click on the item to view its Summary.
-
From the Relationships area in the Summary, click Genealogy.
Detecting Drift on Instances or Images
The configuration of an instance might change over time. Drift is the comparison of an instance to itself at different points in time. The instance needs to be analyzed at least twice to collect this information. Detecting drift provides you the following benefits:
-
See the difference between the last known state of a machine and its current state.
-
Review the configuration changes that happen to a particular instance between multiple points in time.
-
Review the association changes that happen to a particular instance between multiple points in time.
-
Review the classification changes that happen to an instance between two time checks.
-
Capture the configuration drifts for a single instance across a time period.
Detect drift on instances or images:
-
Browse to menu: Compute > Clouds > Instances.
-
Click the accordion for the item to view drift.
-
Click on the item to view its Summary.
-
From the Relationships area in the Summary, click Drift History.
-
Click the checkboxes for the analyses to compare.
-
Click
 (Select up to 10 timestamps for
Drift Analysis)] at the top of the screen. The results display.
 -
Check the Drift sections on the left to view in your comparison.
-
Click Apply.
-
The following descriptions pertain to the Expanded View
 . Whether you see the value of a property
or an icon representing the property depends on the properties type.
. Whether you see the value of a property
or an icon representing the property depends on the properties type.-
A property displayed in the same color as the base means the compared analysis matches the base for that property.
-
A property displayed in a different color from the base means the compared analysis does not match the base for that property.
-
-
If you are in the Compressed View
 , the
values of the properties are not displayed. All items are described
by the icons shown below.
, the
values of the properties are not displayed. All items are described
by the icons shown below.-
A
 (checkmark) means that the
compared analysis matches the base for that property. If you
hover over it, the value of the property will display.
 -
A
 (triangle) means the compared
analysis does not match the base for that property. If you hover
over it, the value of the property displays. Click the minus
sign next to the sections name to collapse it.
-
-
To limit the scope of the view, you have three buttons in the Resource button area.
-
Click
 (All attributes) to see all
attributes of the sections you selected.
 -
Click
 (Attributes with different
values) to see only the attributes that are different across
the drifts.
 -
Click
 (Attributes with the same
values) to see only the attributes that are the same across
drifts.
-
-
To limit the mode of the view, there are two buttons in the Resource button area.
-
Click
 (Details Mode) to see all
details for an attribute.
 -
Click
 (Exists Mode) to only see if
an attribute exists compared to the base or not. This only
applies to attributes that can have a Boolean property. For
example, a user account exists or does not exist, or a piece of
hardware that does or does not exist.
-
This creates a drift analysis. Download the data or create a report from your drift for analysis using external tools.
Creating a Drift Report for an Instance or Image
-
Create the comparison to analyze.
-
Click
 (Download).
 -
Click the output button for the type of report you want.
-
Click
 (Download drift report in text
format) for a text file.
 -
Click
 (Download drift report in CSV
format) for a csv file.
 -
Click
 (Download drift report in PDF
format) for a PDF file.
-
Viewing Analysis History for an Instance or Image
Each time a SmartState Analysis is performed on an instance, a record is created of the task. This information is accessed either from the instance accordion or the instance summary. Use this detail to find when the last analysis was completed and if it completed successfully. If the analysis resulted in an error, the error is shown here.
-
Browse to menu: Compute > Clouds > Instances.
-
Click the accordion for the desired item to view analysis history.
-
Click on the item to view its summary.
-
From the Relationships area in the summary, click Analysis History. A history of up to the last 10 analyses is displayed.

-
Click on a specific analysis to see its details.
Viewing Event Logs for an Instance or Image
Using an Analysis Profile, collect event log information from your instances.
Note:
This feature is only available for Windows.
-
Browse to menu: Compute > Clouds > Instances.
-
Click the accordion for the item to view event logs.
-
Click on the item to view its Summary.
-
From Diagnostics click Event Logs.
The collected event log entries are displayed. Sort this list by clicking on the column headers.
Orchestration Stacks
Browse to menu: Compute > Clouds > Stacks to see a list of orchestration stacks along with information such as Name, Provider, Type, Status, Instances, Security Groups, and Cloud Networks. Click on a stack to see more information about it, including properties, retirement date and time, and relationships with the cloud provider and instances. You can click on instances to see details of all instances the stack relates to.
Tagging Orchestration Stacks
Apply tags to orchestration stacks to categorize them together at the
same time. . Browse to menu: Compute > Clouds > Stacks. . Select the
orchestration stacks to tag. . Click  (Policy), and then
  (Edit Tags). .
Select a customer tag to assign from the first list. . Select a
value to assign from the second list. . Click Save.
Retiring Orchestration Stacks
You can either retire orchestration stacks on a set date and time, or retire them immediately.
To set a retirement date:
-
Browse to menu: Compute > Clouds > Stacks.
-
Select the orchestration stacks to retire on a set date and time.
-
Click
 (Lifecycle), and then
  (Set Retirement
Dates).
 -
On the Retire Orchestration Stacks page, set Retirement Date and Time.
-
Select Retirement Warning from the list. The default is None.
-
Click Save.
Note:
Saving a blank date will remove all retirement dates.
To retire selected stacks immediately:
-
Browse to menu: Compute > Clouds > Stacks.
-
Select the orchestration stacks to retire now.
-
Click
 (Lifecycle), and then
  (Retire selected Orchestration Stacks). A pop-up window appears to confirm the action.
 -
Click OK.
Removing Orchestration Stacks
-
Browse to menu: Compute > Clouds > Stacks.
-
Select the orchestration stacks to remove from the VMDB. A warning pop-up window appears to confirm the action.
-
Click Configuration, and then
 (Remove
Stacks from the VMDB).
 -
Click OK.
Key Pairs
This tab lists key pairs and fingerprints for all cloud providers. Click on a key pair to see a summary and its relationship with instances. On this screen, click on instances to see details of all instances the key pair relates to. You can use the key pairs added during provisioning instances.
Note:
Adding a new key pair is currently only supported for OpenStack.
Adding a New Key Pair
-
Browse to menu: Compute > Clouds > Key Pairs.
-
Click Configuration, then click
 (Add a new Key Pair).
 -
In Basic Information, enter a Name and the Public Key (optional) generated using ssh-keygen command.
-
Select your OpenStack provider from the Provider list.
-
Click Add.
Removing a Key Pair
-
Browse to menu: Compute > Clouds > Key Pairs.
-
Select the key pair you want to remove from the key pairs list. Or, click on the key pair to see the instances it relates to.
-
Click Configuration, then click
 (Remove selected Key Pairs from
Inventory). A warning appears to confirm the action.
 -
Click OK.
Downloading Key Pairs
-
Browse to menu: Compute > Clouds > Key Pairs. You will see a list of existing key pairs.
-
Click the
 button, then
select the option to download key pairs data in your preferred
format:
button, then
select the option to download key pairs data in your preferred
format:-
Download as Text
-
Download as CSV
-
Print or export as PDF
-
Object Stores
Browse to menu: Storage > Object Stores to see a list of all cloud object stores along with information including Key, Size (bytes), Object Count, Cloud Tenant, and Cloud Provider. Click on an object store to see its properties and relationships with the cloud provider, tenant, and object store on the summary page.
Tagging Object Stores
Apply tags to object stores to categorize them together at the same time.
-
Browse to menu: Storage > Object Stores.
-
Select the object stores to tag.
-
Click
 Policy, and then
  Edit Tags.
 -
Select a customer tag to assign from the first list.
-
Select a value to assign from the second list.
-
Click Save.
VMware Networking Switches
After adding a VMware provider, ManageIQ automatically discovers all vSphere distributed switches (vDS) on that provider and collects the information in the ManageIQ inventory.
Browse to menu: Compute > Infrastructure > Networking to see a list of all VMware switches, along with information including Name, Ports, and UUID. Switches and port groups are listed by provider, then cluster on the sidebar.
Click on a switch to view its summary page, which displays relationships with hosts, and any tags.
Tagging VMware Networking Switches
Use tags to categorize vSphere distributed switches.
-
Browse to menu: Compute > Infrastructure > Networking.
-
Select the switches to tag.
-
Click
 (Policy), and then
 (Edit Tags).
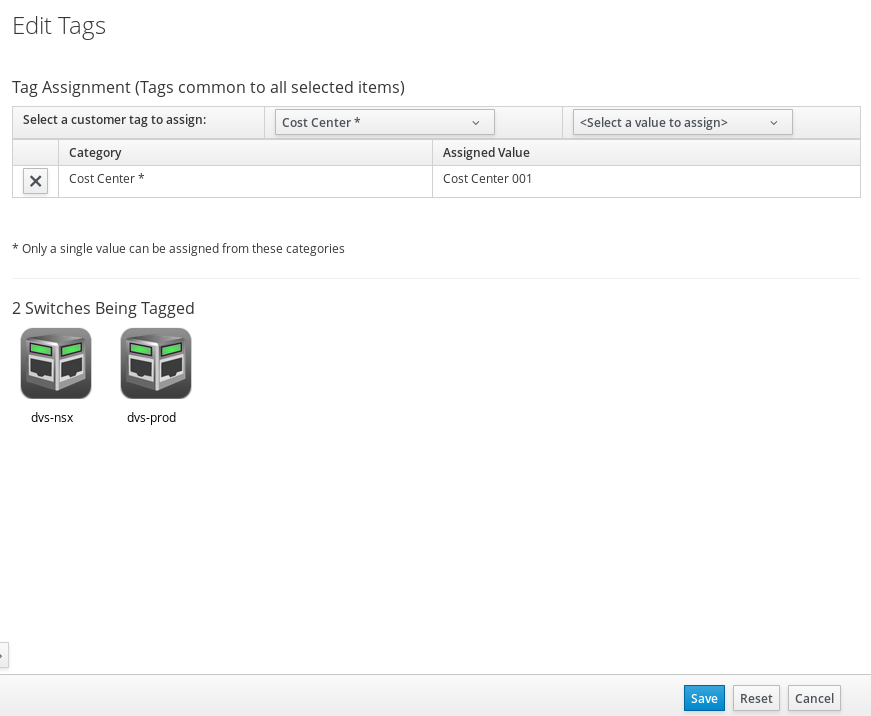
-
Select a customer tag from the first dropdown, and then a value for the tag.
-
Select more tags or click Save to apply the tags.
Container Entities
This chapter provides information on managing resources on your containers providers.
The Containers Overview Page
The containers overview page shows information on all containers providers and entities known to ManageIQ. The Overview page provides links to other summary pages which contain further information on the containers providers and entities. The Overview page also provides metrics for Aggregated Node Utilization, Network Utilization Trend, New Image Usage Trend, Node Utilization, and Pod Creation and Deletion Trends.

-
Browse to menu: Compute > Containers > Overview.
-
Click the desired containers entity, or provider, if applicable, for viewing the summary with further information.
Note:
To reliably associate pods and images, ManageIQ requires
information from the docker-pullable field, added in OpenShift
3.3.1.2. This can affect the results of the Chargeback by Image
report for older OpenShift providers, and potentially cause image
inspection (done as part of Smart State Analysis) to fail due to
associating a container to the wrong image. Consequently,
ManageIQ may not report accurate information about pods
and images in OpenShift providers before version 3.3.1.2.
Viewing a Container Entity Summary
Container entity (object) summaries are found at menu: Compute > Containers > Entity, where you can view information about container entities and their components.
-
Viewing a Containers Provider Summary Browse to menu: Compute > Containers > Providers to view information on different aspects of a containers provider. The summary includes:
-
The status of the provider and its components.
-
The relationships between different entities of the containers provider. These relationships are summarized in the Relationships box on the right-hand side of the summary page.
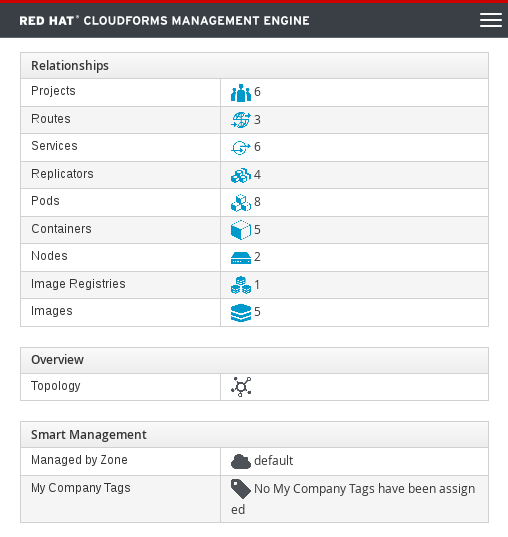
-
Additional information on aggregated capacity of all CPU cores of all nodes, and aggregated capacity of all memory of all nodes.
-
-
Viewing a Container Nodes Summary Browse to menu: Compute > Containers > Container Nodes to view information on different aspects of a container node. The summary includes:
-
The number of entities on a node.
-
A node’s capacity and utilization.
-
The version of the underlying operating system and software.
-
To view the timeline of events for a node from a container nodes summary
page, click  (Monitoring), and then
 (Timelines).
-
Viewing a Containers Summary Browse to menu: Compute > Containers > Containers to view information on different aspects of a container. The summary includes:
-
The relationships of the container to a related node, pod, or image.
-
The node the container runs on.
-
The container ID.
-
Properties of the container image, such as name, tag, etc.
-
-
Viewing a Container Images Summary Browse to menu: Compute > Containers > Container Images to view information on different aspects of a container image. The summary includes:
-
The containers currently using the images.
-
The image registry the image is from.
-
-
Viewing an Image Registries Summary Browse to menu: Compute > Containers > Image Registries to view information on different aspects of an image registry. The summary includes:
-
Which images are from the registry.
-
The number of images that come from that registry.
-
Which containers use images from that registry.
-
The host and port of the registry.
-
-
Viewing a Pods Summary Browse to menu: Compute > Containers > Pods to view information on different aspects of a pod. The summary includes:
-
The containers that are part of the pod.
-
The services that reference the pod.
-
The node the pod runs on.
-
If the pod controlled by a replicator.
-
The IP address of the pod.
-
-
Viewing a Replicators Summary Browse to menu: Compute > Containers > Replicators to view information on different aspects of a replicator. The summary includes:
-
The number of requested pods.
-
The number of current pods.
-
The labels and selector for the replicator.
-
-
Viewing a Container Services Summary Browse to menu: Compute > Containers > Container Services to view information on different aspects of a container service. The summary includes:
-
The pods that the container service provide traffic to.
-
The port configurations for the container service.
-
The labels and selector for the container service.
-
-
Viewing a Volumes Summary Browse to menu: Compute > Containers > Volumes to view information on the persistent volumes of a container provider. The summary includes:
-
The pods the volume is connected to.
-
The volume’s connection parameters.
-
The volume’s storage capacity.
-
The volume’s iSCSI target details (if applicable).
-
-
Viewing a Container Builds Summary Browse to menu: Compute > Containers > Container Builds to view different aspects of a container build. The summary includes:
-
The build configuration the container build is based on.
-
Which build instances have been created.
-
Which phase in the build process the instance has completed.
-
Which pod a build instance reside in.
-
-
Viewing a Container Templates Summary Browse to menu: Compute > Containers > Container Templates to view different aspects of a container template. The summary includes:
-
The project the template is associated with.
-
The objects the template contains.
-
The parameters that can be used with the template’s objects.
-
The template’s version number.
-
Using the Topology Widget
The Topology widget is an interactive topology graph, showing the status and relationships between the different entities of the containers providers and projects to which ManageIQ has access.
-
The topology graph includes pods, containers, services, nodes, virtual machines, hosts, routes, and replicators within the overall containers provider environment. - Each entity in the graph displays a color indication of its status.
-
Hovering over any individual graph element will display a summary of details for the individual element.
-
Double-click the entities in the graph to browse to their summary pages.
-
It is possible to drag elements to reposition the graph.
-
Click the legend at the top of the graph to show or hide entities.
-
Click Display Names on the right-hand side of the page to show or hide entity names.
Viewing the Topology for Container Providers
-
Browse to menu: Compute > Containers > Providers.
-
Click the desired containers provider for viewing the provider summary.
-
On the provider summary page, click Topology in the Overview box on the right side of the page.
Viewing the Topology for Container Provider Projects
The project topology page displays the project as the center node, surrounded by its related entities.
-
Browse to menu: Compute > Containers > Projects.
-
Click on a project.
-
On the project summary page, click
 (Topology View) on the
top right side of the page.
Limiting the Number of Containers Shown in the Topology View
-
Navigate to the settings menu, then My Settings, and click on the Visual tab.
-
Select the number of container items from the drop-down under Topology Default Items in View.
-
Click Save.
Analyzing Container Images with SmartState Analysis
Perform a SmartState Analysis of a container image to inspect the packages included in an image.
-
Browse to menu: Compute > Containers > Container Images.
-
Check the container image to analyze. You can check multiple images.
-
Click Configuration, and then
 Perform SmartState Analysis.
The container image is scanned. The process will copy over any required files for the image. After reloading the image page, all new or updated packages are listed.
To monitor the status of container image SmartState Analysis tasks, navigate to the settings menu, then Tasks. The status of each task is displayed including time started, time ended, what part of the task is currently running, and any errors encountered.
Note:
See Scanning Container Images in with OpenSCAP for details on scanning container images using OpenSCAP policies.
Configuring Automatic Tagging for Container Entities
Container object labels in OpenShift can be used to automatically create tags and tag categories in ManageIQ. This is done by mapping ManageIQ tags to existing OpenShift or Kubernetes labels.
Labels from OpenShift can be mapped to ManageIQ tags for the following container entities:
-
Projects
-
Nodes
-
Routes
-
Replicators
-
Container services
-
Pods
-
Container builds
Note:
Tags automatically created from OpenShift labels are completely managed by the ManageIQ system and cannot be manually assigned or unassigned. Deleting a mapping rule from ManageIQ immediately deletes the resulting tags.
You can view a container entity’s OpenShift labels on the entity’s details page under Labels.
The following example shows how to configure tagging for a node, but the same steps can be used for mapping labels to tags on other container entities.
To configure automatic tagging on container entities using labels:
-
Note the key of the OpenShift label you want to map to a ManageIQ tag. OpenShift labels consist of two parts: a key and a value.
-
Browse to menu: Compute > Containers > Container Nodes.
-
Select a node to open its summary page.
-
Under Labels, note the label(s) to map to ManageIQ tag(s). Any OpenShift labels will list the key in the left column of the Labels table, and the value in the right column of the Labels table.
This node has six labels (key/value pairs) that were created in OpenShift and collected in the ManageIQ inventory:
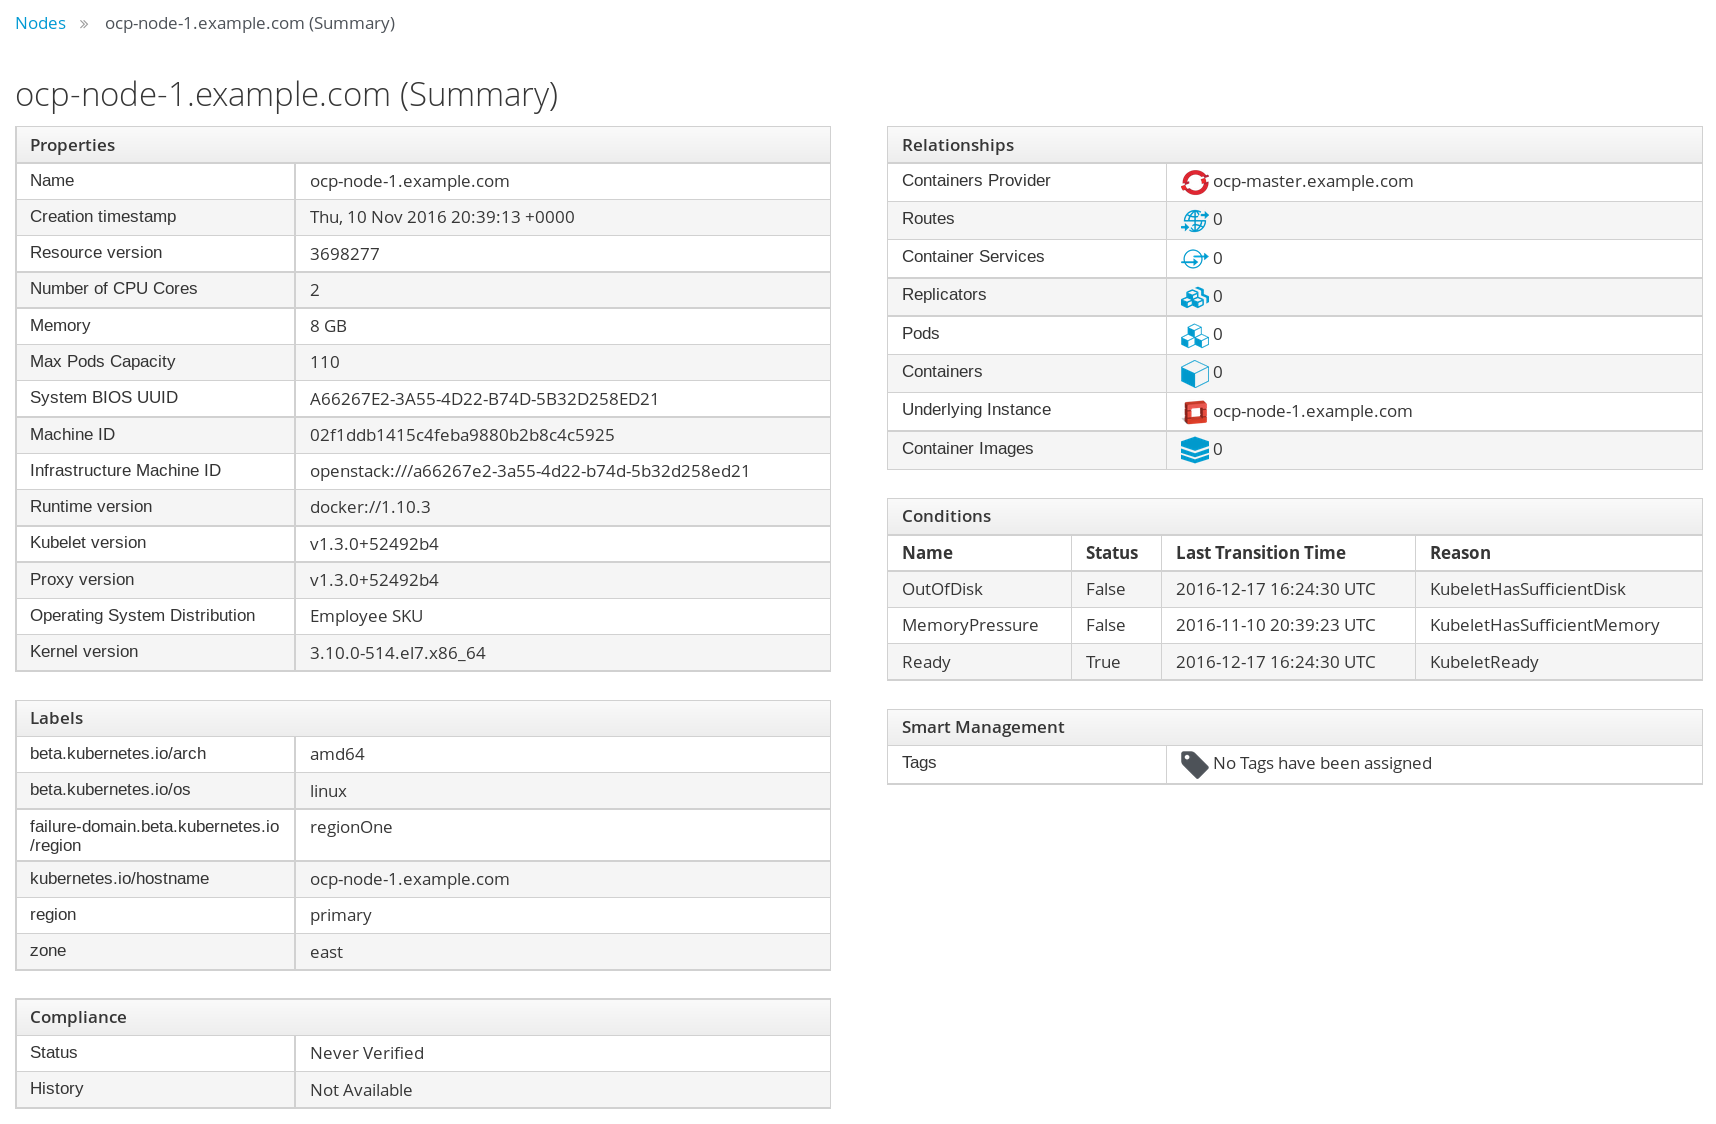
Note:
To create an OpenShift label, see Developer CLI Operations in the OpenShift Container Platform CLI Reference guide. A new label added in OpenShift will only show up in ManageIQ after the next OpenShift provider refresh.
-
-
Navigate to Configuration and select the region.
-
Click the Map Tags tab.
-
Click Add to create a new mapping rule.
-
Select a container entity to tag from the Entity list, or select All to tag all entities.
-
Specify the key from the OpenShift label you noted earlier in the Label field.
-
Specify a ManageIQ tag category in Category to map the label to. If the tag category does not exist yet in ManageIQ, it will be created automatically.
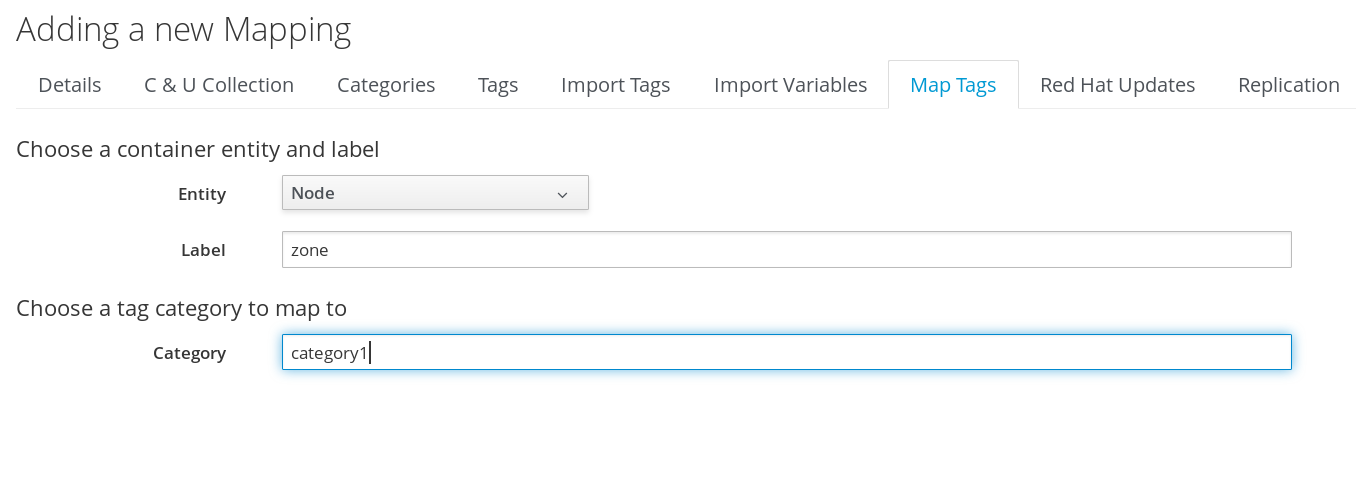
-
Click Add. The mapping will show in the table on the Map Tags tab.
-
-
Refresh the provider to complete the mapping:
-
Browse to menu: Compute > Containers > Providers.
-
Select the provider to refresh.
-
Click Configuration, and then
 Refresh Items and Relationships.
-
The label will display on the entity’s summary page under Smart Management under Company Tags as <Category> : <value>.
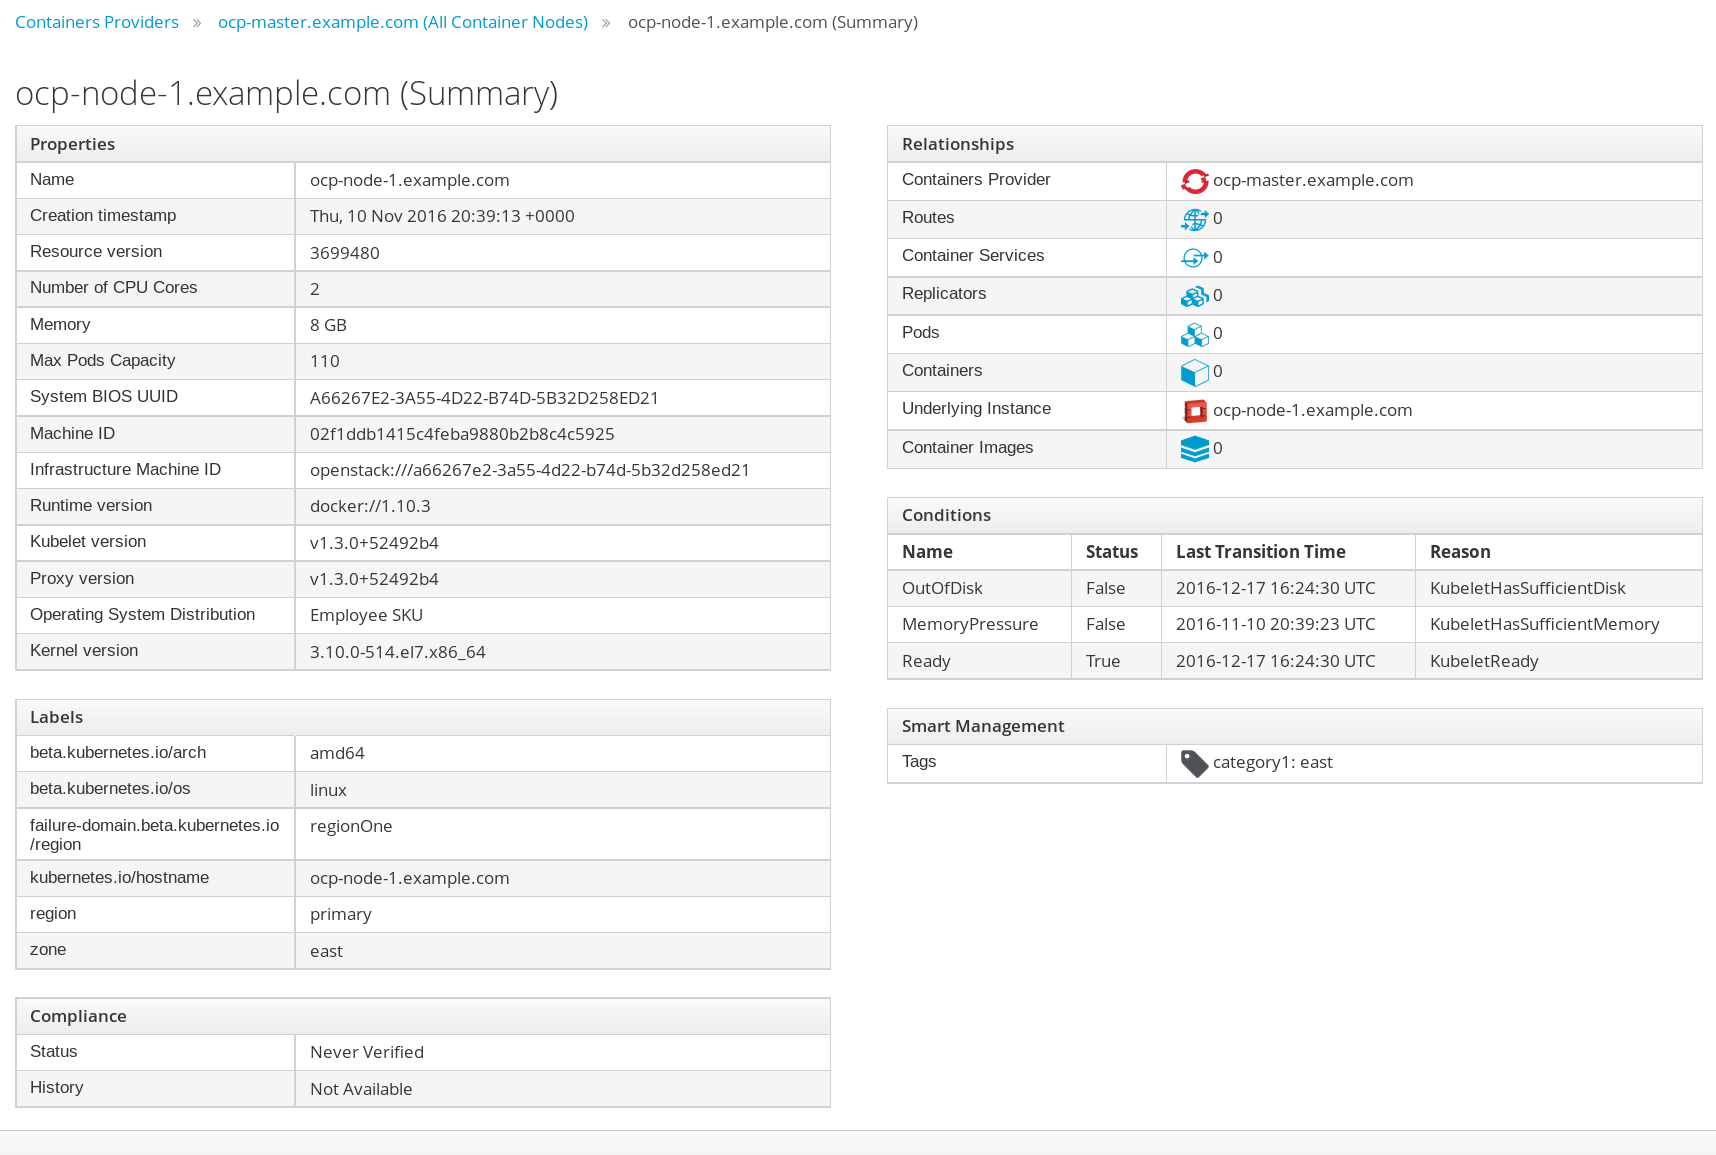
- Any container entity with the OpenShift
zonelabel will be tagged automatically ascategory1in ManageIQ. If the value forzoneissouth, for example, the entity will be tagged as `category1 - south`.
You can use these tags to create reports. See Monitoring, Alerts, and Reporting for details on creating reports.
