On behalf of the ManageIQ team, I’m happy to announce the release of ManageIQ Petrosian! This release is named after the chess grandmaster Tigran Petrosian. You can download the Petrosian-1 release on our downloads page.
ManageIQ Blog
ManageIQ Oparin GA Announcement
On behalf of the ManageIQ team, I’m happy to announce the release of ManageIQ Oparin! This release is named after the chess grandmaster Grigoriy Oparin. You can download the Oparin-1 release on our downloads page.
ManageIQ Najdorf GA Announcement
On behalf of the ManageIQ team, I’m happy to announce the release of ManageIQ Najdorf! This release is named after the chess grandmaster Miguel Najdorf. You can download the Najdorf-1 release on our downloads page.
ManageIQ Morphy GA Announcement
On behalf of the ManageIQ team, I’m happy to announce the release of ManageIQ Morphy! This release is named after the chess grandmaster Paul Morphy. You can download the Morphy-1 release on our downloads page.
RbVmomi Maintenance
I have the pleasure of announcing that the ManageIQ community has forked and will be maintaining the RbVmomi gem as rbvmomi2. RbVmomi is a Ruby SDK for the VMware vSphere Web Services API which allows users to manage their virtual infrastructure.
Announcing Morphy Beta
The first beta release of ManageIQ Morphy is here! We’ve been working hard and have a lot of new features you can see in the roadmap. Here are the major highlights for this new release:
Morphy Release Approach
We have been working on a number of interesting features. Typically, the way these get released is that we cut a release branch from the master branch and work on stabilizing it to get to a release. However, at this time we feel the master branch is a bit too fluid to stabilize just yet. At the same time, there are a number of new features that are less risky and would provide a benefit to the community via an official release. So, what we have decided to do is to release them in a different way.
ManageIQ Lasker GA Announcement
On behalf of the ManageIQ team, I’m happy to announce the release of ManageIQ Lasker! This release is named after the chess grandmaster Emanuel Lasker. You can download the Lasker-1 release on our downloads page.
CVE-2021-32756, Kasparov-2, Jansa-4
ManageIQ Kasparov-2 and Jansa-4 are now available. These releases include a security fix, which is also included in the new Lasker-1 GA release. Many thanks goes to Jason Frey (@Fryguy) and Gregg Tanzillo (@gtanzillo) for finding and fixing these vulnerabilities. Also, many thanks go to all of the contributors for all of their enhancements and bug fixes.
ManageIQ performance results and improvements
This document describes performance measurements for the ManageIQ Kasparov release in both podified and appliance mode, and performance improvements that have been made as a result. The purpose of these measurements was to show the behavior of ManageIQ as the number of providers and managed resources are increased, and to look for inhibitors to scalability. Podified measurements were taken on Red Hat OpenShift Container Platform (OCP) running on a VMware vSphere cluster dedicated to performance measurements. Appliance measurements were taken on a VM running on the same VMware vSphere cluster.
Measurement configuration
These measurements were taken on a vCenter dedicated to performance measurements with the following configuration:
- Hypervisor: VMware ESXi, 6.7.0, 15160138
- Model: IBM System X iDataPlex dx360 M4 Server -[7912AC1]-
- Processor Type: Intel(R) Xeon(R) CPU E5-2665 0 @ 2.40GHz
- 14 ESX hosts: 16 cores (32 logical processors), 256 GB Total Memory
The podified measurements were taken on an OCP cluster with the following characteristics:
- OCP 4.6.15
- Kasparov branch
- 3 OCP masters (8 core, 32 GB RAM)
- 4 workers (8 core, 32 GB RAM)
The appliance measurements were taken on a single VM running on the same vSphere cluster, with 16 cores, 64 GB RAM and a separate 200 GB hard disk.
ManageIQ was configured with all server roles enabled, except Git Repositories Owner. C & U Collection (metric collection) was enabled for all clusters and all datastores.
For these measurements, up to 13 providers were added in a single, default zone:
- 1 Amazon Web Service cloud provider
- 1 Azure cloud provider
- 1 VMware infrastructure provider
- 10 additional VMware infrastructure providers simulated with the vCenter Server Simulator (VCSIM) tool, which is an unsupported tool available for free from VMware. Each simulated vCenter runs on a separate VM.
Steady state CPU utilization
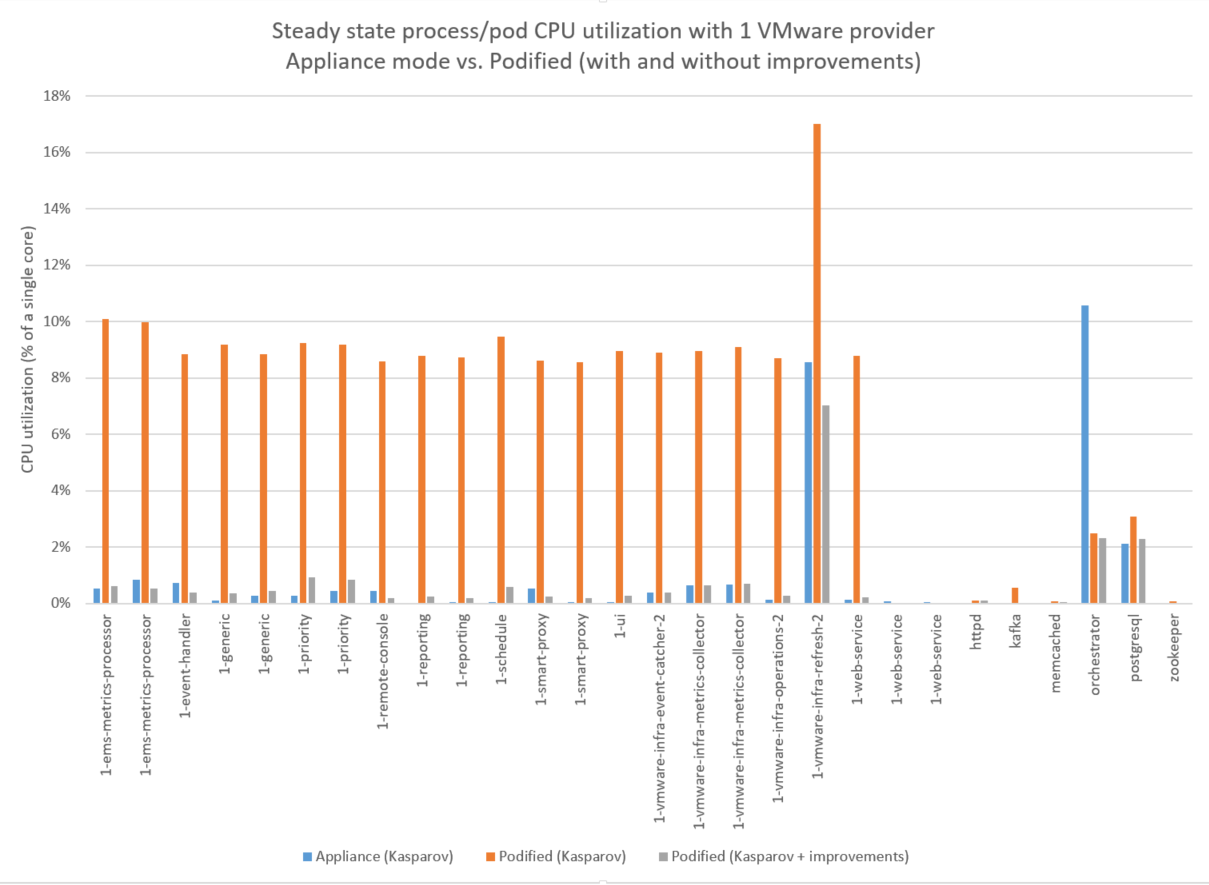
The figure above shows the average process/pod CPU usage over a 2 hour period with the VMware provider running. The appliance results (in blue) show the process-level CPU utilization based on data from the Linux ps command. The podified results (in orange) show the pod-level CPU utilization from prometheus/grafana. For most worker pods, CPU utilization in podified mode is consistently 8-9% higher than appliance mode. In investigating this difference, the development team found that the extra overhead was caused by the liveness probe. Rewriting and optimizing the liveness check resulted in a 20x speedup. The podified results with the optimized liveness check show up as gray bars in the figure. The worker pods each show an 8-9% reduction in steady state CPU utilization. This performance improvement is included in the Lasker branch.
The figure above also shows that the orchestrator CPU usage is lower in podified mode. This is because the orchestrator pod doesn’t have to do the extra work of collecting worker CPU and memory usage, tracking worker heartbeats, and managing resource limits as it does in appliance mode. For podified mode, this extra work is handled by Kubernetes.
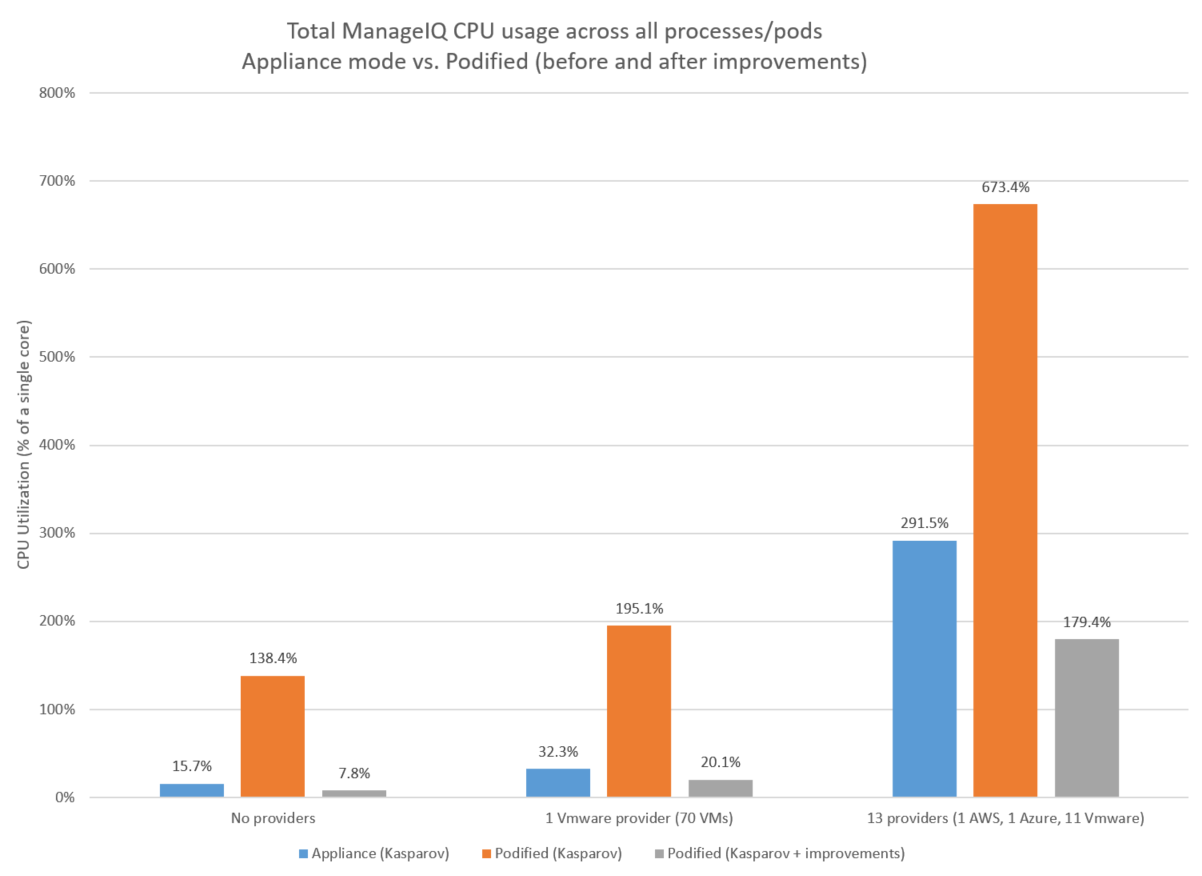
The figure above shows the total steady state ManageIQ CPU usage across all processes/pods for three workload scenarios:
- No providers defined
- 1 VMware provider
- 13 providers For each workload scenario, the podified CPU usage is dramatically reduced (ranging from 74 to 94% lower) with the liveness probe improvement. With the improvement, total ManageIQ podified CPU usage is lower than appliance mode in each case.
VMDB database measurements
The ManageIQ architecture includes the Virtual Management Database (VMDB), which is “the definitive source of intelligence collected about your Virtual Infrastructure”. During our performance measurements, we collected postgres statistics to see the total size, number of rows and activity for each of the 300+ tables in the VMDB database.
The biggest tables in the vmdb database are related to metric collection. The following observations are based on the postgres stats and discussion with development:
- 24 raw tables, one per hour (metrics_00, metrics_01 … metrics_23)
- Only the most recent four hours of raw metrics are kept, and every hour, the table with data older than 4 hours is truncated.
- For each resource, metrics are collected in 20 second intervals. Each resource gets one metric row per collection interval, with up to 180 rows collected per hour.
- For the VMware data provider, collected resources are clusters, hosts and VMs.
- For the AWS data provider, the collected resources are online instances (not offline or suspended)
- For the Azure data provider, metrics are not collected unless the Microsoft.Insights resource provider is enabled, which was not the case in our measurements
- The average row size for raw metrics is 715 bytes, based on observations with the VMware data provider.
- 12 rollup tables, one per month (metric_rollups_01, metric_rollups_02 … metric_rollups_12)
- Each resource gets one metric_rollups row per hour and another metric_rollup row per day.
- The average row size for metric_rollups is 680 bytes, based on observations with the VMware data provider.
- vim_performance_states table
- This table gets one row, per resource per hour, for each resource with records in the metric_rollups tables. The rows in this table represent the state of the resource when the rollup was performed.
- The average row size for the vim_performance_state table is 716 bytes, base on observations with the VMware data provider.
If metric collection is enabled, the above tables will be by far the biggest contributors to the vmdb database size.
To estimate the size of the metric collection portion of the database, you could use the following formula to estimate the storage in MB for one year for a given number of resources.
(number of resources) * ((180 raw rows/hour * 4 hours * 715 bytes/row) + (25 rollup rows/day * 365 days * (680 bytes/row) + (25 vim_performance_states rows/day * 365 days * 716 bytes/row))) / 1024 /1024
Which reduces to
(number of resources) * 12.6 MB
For 1,000 resources, the tables related to metric collection should grow to about 12 GB.
Conclusion
This article describes results from our recent performance measurements of the ManageIQ Kasparov branch, including performance improvements that were made based on these findings. The results show that, with these improvements, ManageIQ in podified mode can perform as well or better than appliance mode.